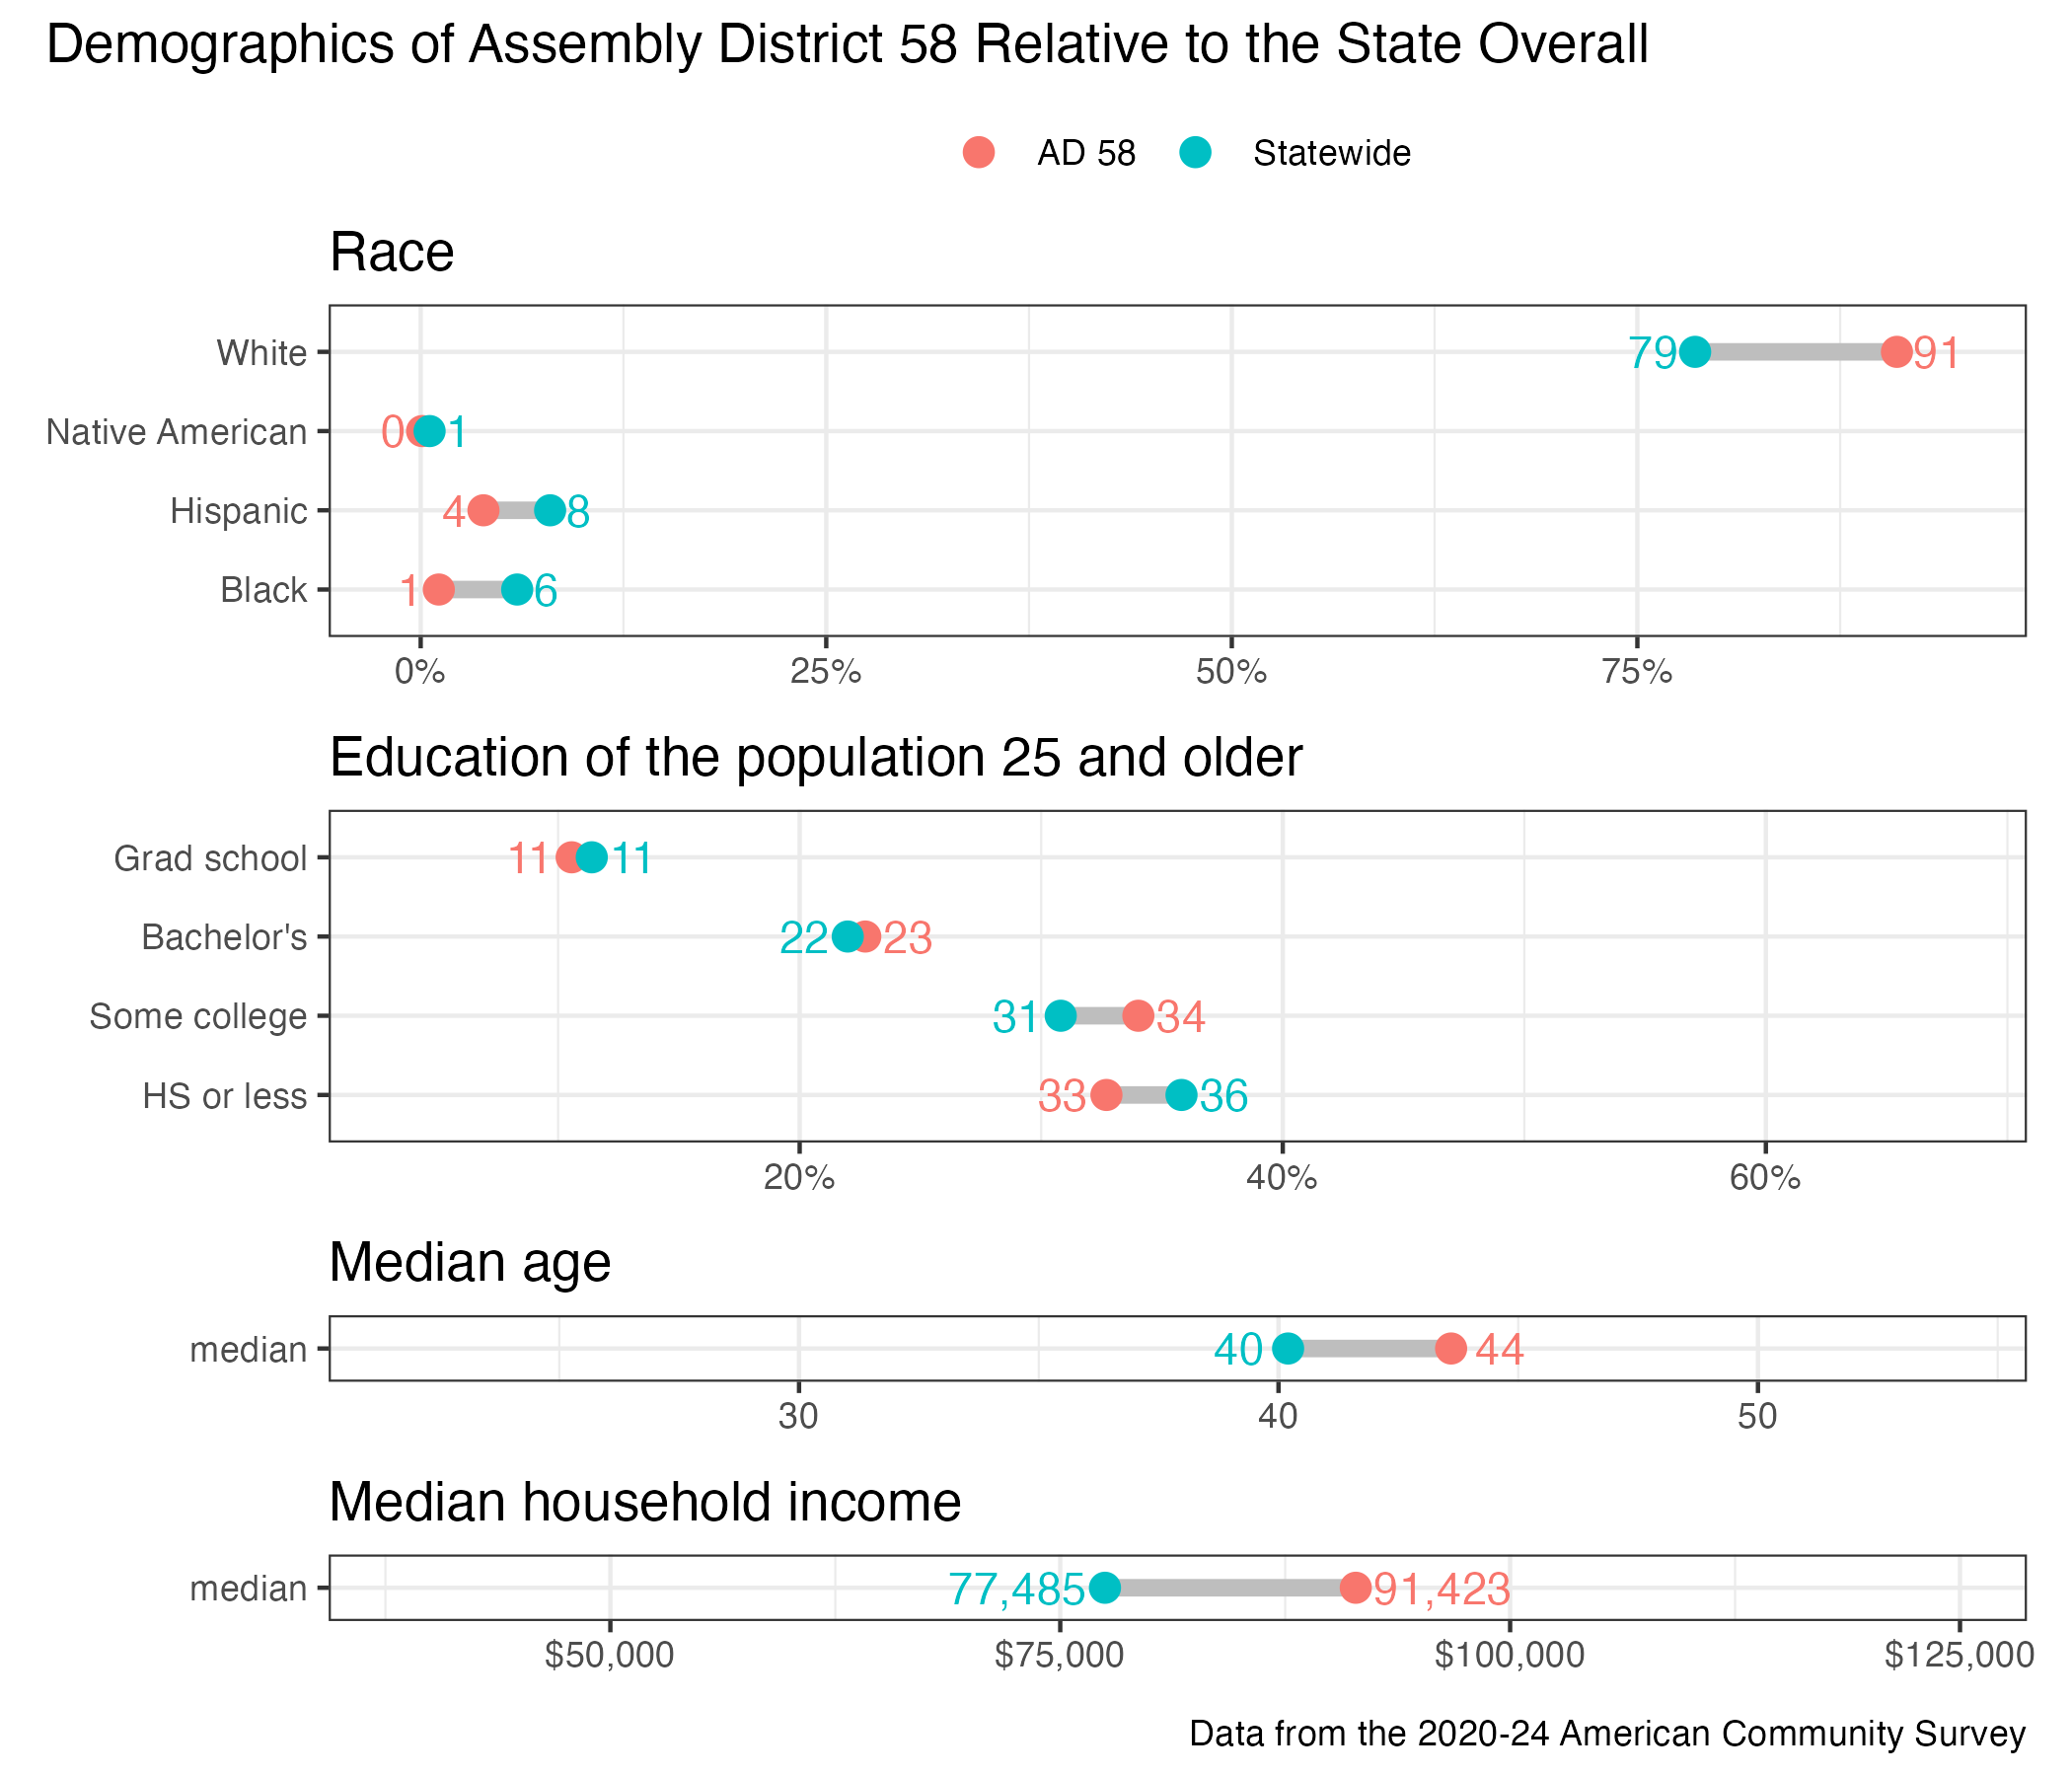
58th Assembly District
District
Candidates
| Assembly District 58 Candidates on the Primary Ballot | ||
| Incumbent: Rick Gundrum (Filed Notification of Noncandidacy) | ||
Jan 1 thru July 30
|
||
|---|---|---|
| receipts | disbursements | |
| Republican | ||
| Bernie Newman | $7,696.12 | $5,933.13 |
| Christopher D. Bossert | $2,600.00 | $1,120.33 |
| Democratic | ||
| Dennis D. Degenhardt | $729.00 | $0.14 |
| Data from the 2026 July Continuing Report. Any amended reports might not yet be shown. | ||
Past election results
| Election Results in Wisconsin State Assembly District 58 | ||||||
votes
|
Dem. %1 |
margin (Dem. - Rep.)
|
||||
|---|---|---|---|---|---|---|
| total | Dem. | Rep. | votes | points2 | ||
| 2016 President | 32,402 | 8,805 | 21,816 | 28.8% | −13,011 | −42.5 |
| 2016 Senator | 32,636 | 8,445 | 23,451 | 26.5% | −15,006 | −47.0 |
| 2018 Governor | 29,460 | 7,904 | 21,182 | 27.2% | −13,278 | −45.7 |
| 2018 Senator | 29,307 | 9,687 | 19,618 | 33.1% | −9,931 | −33.9 |
| 2020 President | 37,209 | 11,156 | 25,530 | 30.4% | −14,374 | −39.2 |
| 2022 Governor | 30,714 | 9,385 | 21,077 | 30.8% | −11,692 | −38.4 |
| 2022 Senator | 30,714 | 8,925 | 21,789 | 29.1% | −12,864 | −41.9 |
| 2024 President | 38,691 | 12,009 | 26,113 | 31.5% | −14,104 | −37.0 |
| 2024 Senator | 38,425 | 11,869 | 25,867 | 31.5% | −13,998 | −37.1 |
| 2024 WI Assembly | 37,675 | 10,786 | 26,847 | 28.7% | −16,061 | −42.7 |
| 2025 WI Sup. Ct.3 | 26,863 | 9,048 | 17,803 | 33.7% | −8,755 | −32.6 |
| 1 Share of the two-party vote. For Rep. share, subtract from 100. | ||||||
| 2 Dem % of the two-party vote minus Rep % of the two-party vote | ||||||
| 3 Formally nonpartisan candidates assigned party labels based on state endorsements | ||||||
| Election results allocated into 2024 district boundaries based on population overlap. Calculations by John Johnson (johndjohnson.info). | ||||||
District demographics