48th Assembly District
District
Candidates
| Assembly District 48 Candidates on the Primary Ballot | ||
| Incumbent: Andrew Hysell | ||
Jan 1 thru July 30
|
||
|---|---|---|
| receipts | disbursements | |
| Republican | ||
| Mark Kjorlie | $1,610.00 | $389.75 |
| Democratic | ||
| Andrew Hysell | $7,289.14 | $6,168.05 |
| Data from the 2026 July Continuing Report. Any amended reports might not yet be shown. | ||
Past election results
| Election Results in Wisconsin State Assembly District 48 | ||||||
votes
|
Dem. %1 |
margin (Dem. - Rep.)
|
||||
|---|---|---|---|---|---|---|
| total | Dem. | Rep. | votes | points2 | ||
| 2016 President | 28,813 | 17,509 | 9,325 | 65.2% | +8,184 | +30.5 |
| 2016 Senator | 28,637 | 18,075 | 9,918 | 64.6% | +8,157 | +29.1 |
| 2018 Governor | 26,762 | 17,743 | 8,544 | 67.5% | +9,199 | +35.0 |
| 2018 Senator | 26,670 | 18,544 | 8,088 | 69.6% | +10,456 | +39.3 |
| 2020 President | 34,713 | 23,352 | 10,737 | 68.5% | +12,615 | +37.0 |
| 2022 Governor | 29,155 | 20,599 | 8,312 | 71.3% | +12,287 | +42.5 |
| 2022 Senator | 29,050 | 20,026 | 8,952 | 69.1% | +11,074 | +38.2 |
| 2024 President | 37,195 | 25,148 | 11,402 | 68.8% | +13,746 | +37.6 |
| 2024 Senator | 36,978 | 25,122 | 11,238 | 69.1% | +13,884 | +38.2 |
| 2024 WI Assembly | 35,379 | 23,816 | 11,509 | 67.4% | +12,307 | +34.8 |
| 2025 WI Sup. Ct.3 | 27,185 | 20,328 | 6,836 | 74.8% | +13,492 | +49.7 |
| 1 Share of the two-party vote. For Rep. share, subtract from 100. | ||||||
| 2 Dem % of the two-party vote minus Rep % of the two-party vote | ||||||
| 3 Formally nonpartisan candidates assigned party labels based on state endorsements | ||||||
| Election results allocated into 2024 district boundaries based on population overlap. Calculations by John Johnson (johndjohnson.info). | ||||||
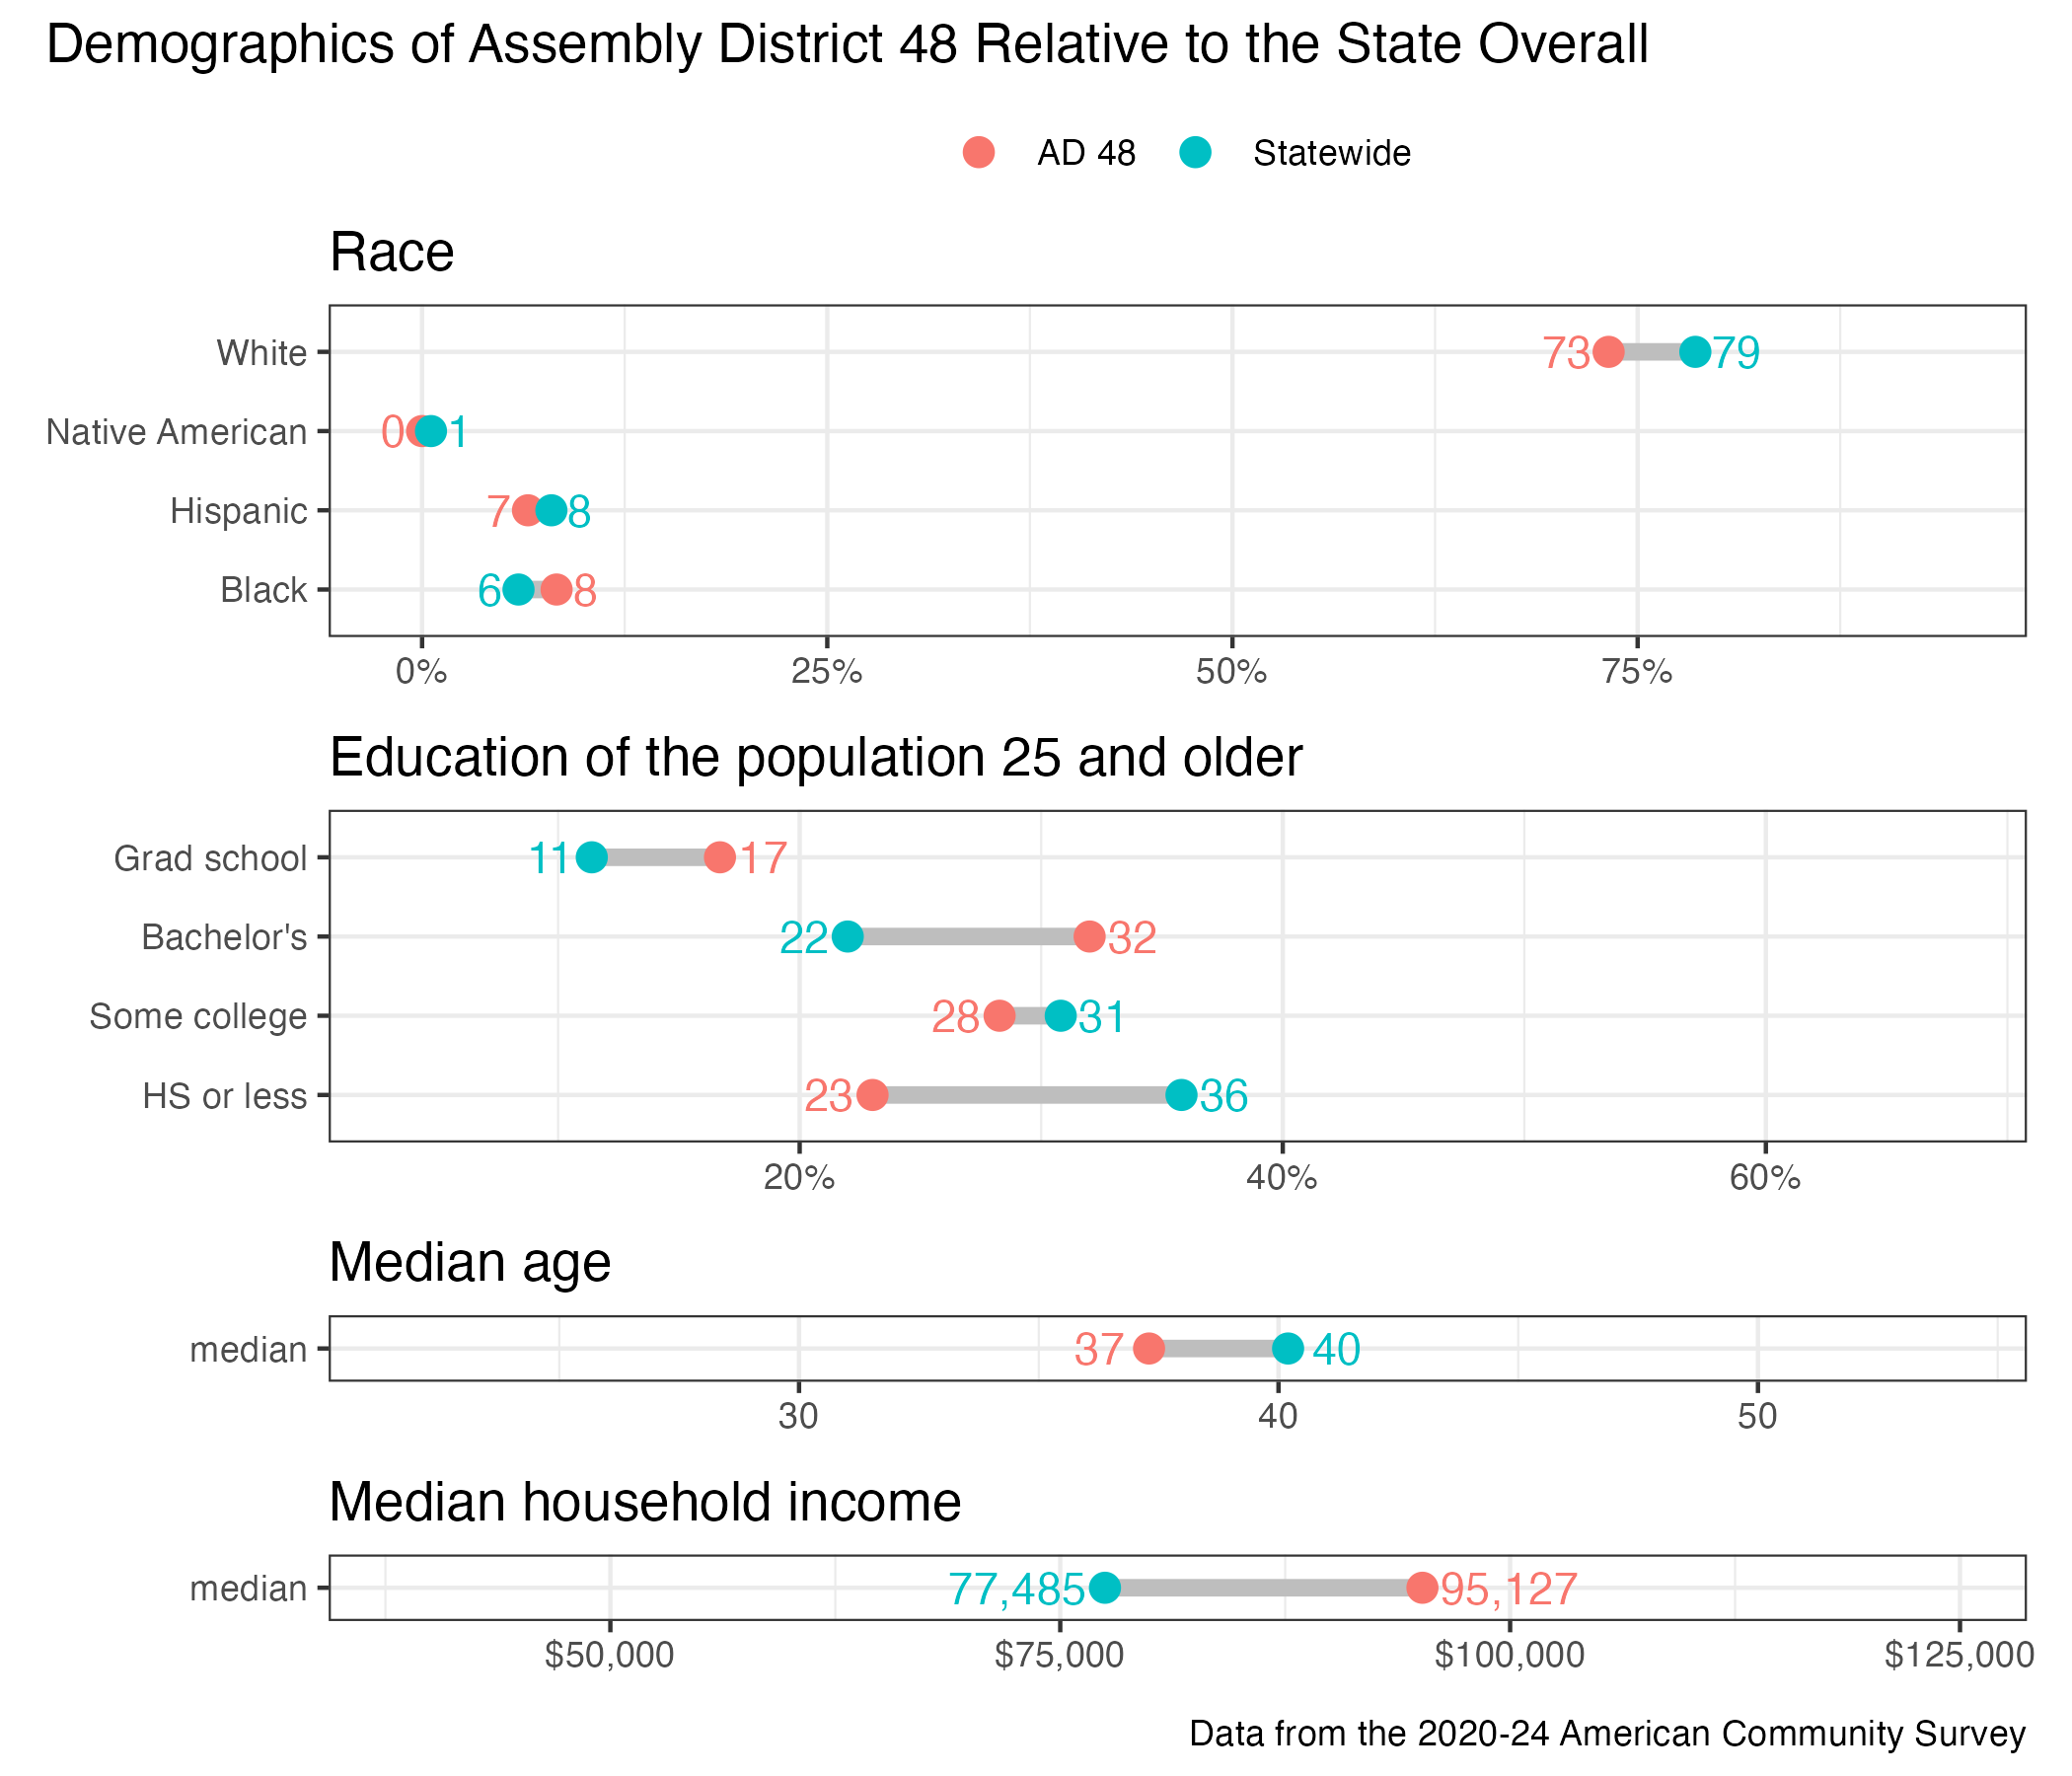
District demographics