51st Assembly District
District
Candidates
| Assembly District 51 Candidates on the Primary Ballot | ||
| Incumbent: Todd Novak | ||
Jan 1 thru July 30
|
||
|---|---|---|
| receipts | disbursements | |
| American Solidarity Party | ||
| Nathan Tataje | $0.00 | $21.24 |
| Republican | ||
| Todd Novak | $25,039.00 | $8,339.57 |
| Democratic | ||
| Ben Gruber | $92,563.59 | $10,599.58 |
| Data from the 2026 July Continuing Report. Any amended reports might not yet be shown. | ||
Past election results
| Election Results in Wisconsin State Assembly District 51 | ||||||
votes
|
Dem. %1 |
margin (Dem. - Rep.)
|
||||
|---|---|---|---|---|---|---|
| total | Dem. | Rep. | votes | points2 | ||
| 2016 President | 29,437 | 15,144 | 12,410 | 55.0% | +2,734 | +9.9 |
| 2016 Senator | 29,272 | 16,539 | 12,013 | 57.9% | +4,526 | +15.9 |
| 2018 Governor | 26,618 | 15,182 | 10,931 | 58.1% | +4,251 | +16.3 |
| 2018 Senator | 26,442 | 16,592 | 9,829 | 62.8% | +6,763 | +25.6 |
| 2020 President | 33,538 | 17,905 | 15,099 | 54.3% | +2,806 | +8.5 |
| 2022 Governor | 27,516 | 15,582 | 11,632 | 57.3% | +3,950 | +14.5 |
| 2022 Senator | 27,423 | 14,756 | 12,620 | 53.9% | +2,136 | +7.8 |
| 2024 President | 34,987 | 17,810 | 16,589 | 51.8% | +1,221 | +3.5 |
| 2024 Senator | 34,706 | 18,367 | 15,673 | 54.0% | +2,694 | +7.9 |
| 2024 WI Assembly | 34,230 | 16,524 | 17,682 | 48.3% | −1,158 | −3.4 |
| 2025 WI Sup. Ct.3 | 25,345 | 15,194 | 10,141 | 60.0% | +5,053 | +19.9 |
| 1 Share of the two-party vote. For Rep. share, subtract from 100. | ||||||
| 2 Dem % of the two-party vote minus Rep % of the two-party vote | ||||||
| 3 Formally nonpartisan candidates assigned party labels based on state endorsements | ||||||
| Election results allocated into 2024 district boundaries based on population overlap. Calculations by John Johnson (johndjohnson.info). | ||||||
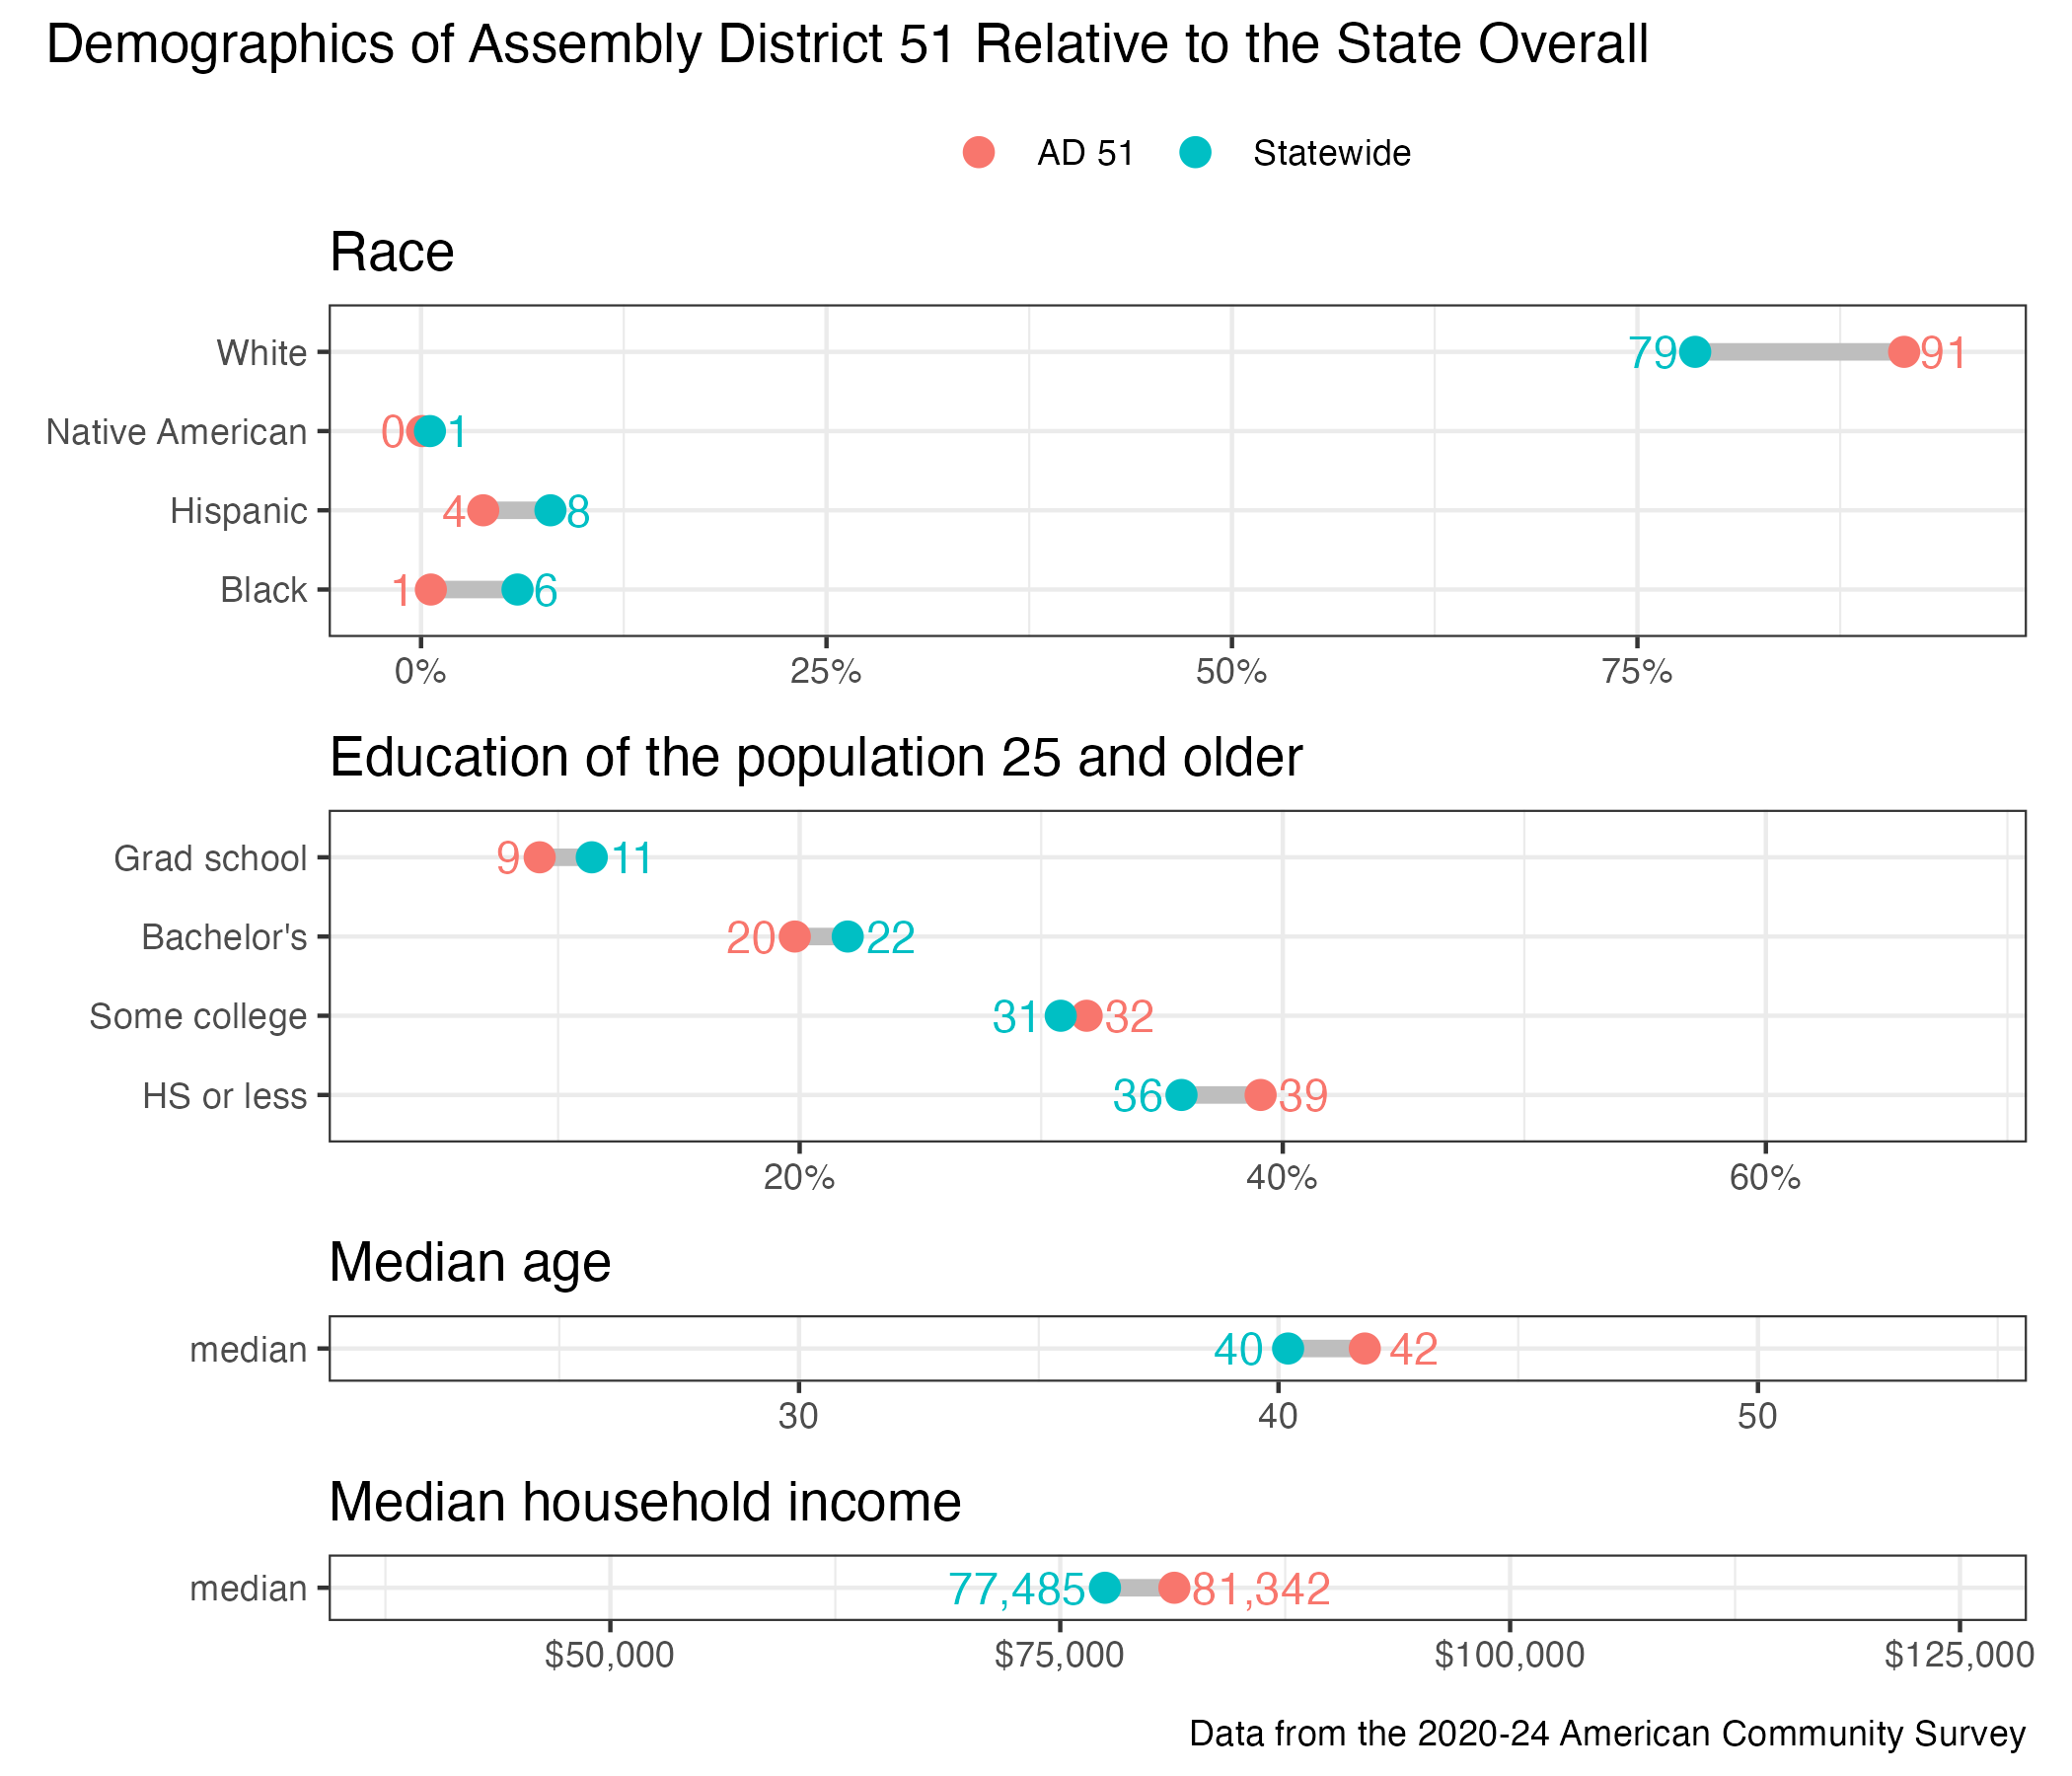
District demographics