74th Assembly District
District
Candidates
| Assembly District 74 Candidates on the Primary Ballot | ||
| Incumbent: Chanz J Green | ||
Jan 1 thru July 30
|
||
|---|---|---|
| receipts | disbursements | |
| Republican | ||
| Chanz Green | $4,119.31 | $4,384.03 |
| Scott Harbridge | $7,382.00 | $3,495.55 |
| Democratic | ||
| Paul Johnson | $3,250.00 | $50.00 |
| Data from the 2026 July Continuing Report. Any amended reports might not yet be shown. | ||
Past election results
| Election Results in Wisconsin State Assembly District 74 | ||||||
votes
|
Dem. %1 |
margin (Dem. - Rep.)
|
||||
|---|---|---|---|---|---|---|
| total | Dem. | Rep. | votes | points2 | ||
| 2016 President | 32,211 | 12,339 | 18,252 | 40.3% | −5,913 | −19.3 |
| 2016 Senator | 31,540 | 12,948 | 17,664 | 42.3% | −4,716 | −15.4 |
| 2018 Governor | 28,254 | 12,429 | 15,258 | 44.9% | −2,829 | −10.2 |
| 2018 Senator | 27,989 | 13,861 | 14,119 | 49.5% | −258 | −0.9 |
| 2020 President | 36,681 | 14,932 | 21,290 | 41.2% | −6,358 | −17.6 |
| 2022 Governor | 29,897 | 12,445 | 17,087 | 42.1% | −4,642 | −15.7 |
| 2022 Senator | 29,899 | 11,925 | 17,947 | 39.9% | −6,022 | −20.2 |
| 2024 President | 38,783 | 14,879 | 23,362 | 38.9% | −8,483 | −22.2 |
| 2024 Senator | 38,365 | 15,164 | 22,397 | 40.4% | −7,233 | −19.3 |
| 2024 WI Assembly | 37,468 | 14,051 | 23,396 | 37.5% | −9,345 | −25.0 |
| 2025 WI Sup. Ct.3 | 27,208 | 11,768 | 15,427 | 43.3% | −3,659 | −13.5 |
| 1 Share of the two-party vote. For Rep. share, subtract from 100. | ||||||
| 2 Dem % of the two-party vote minus Rep % of the two-party vote | ||||||
| 3 Formally nonpartisan candidates assigned party labels based on state endorsements | ||||||
| Election results allocated into 2024 district boundaries based on population overlap. Calculations by John Johnson (johndjohnson.info). | ||||||
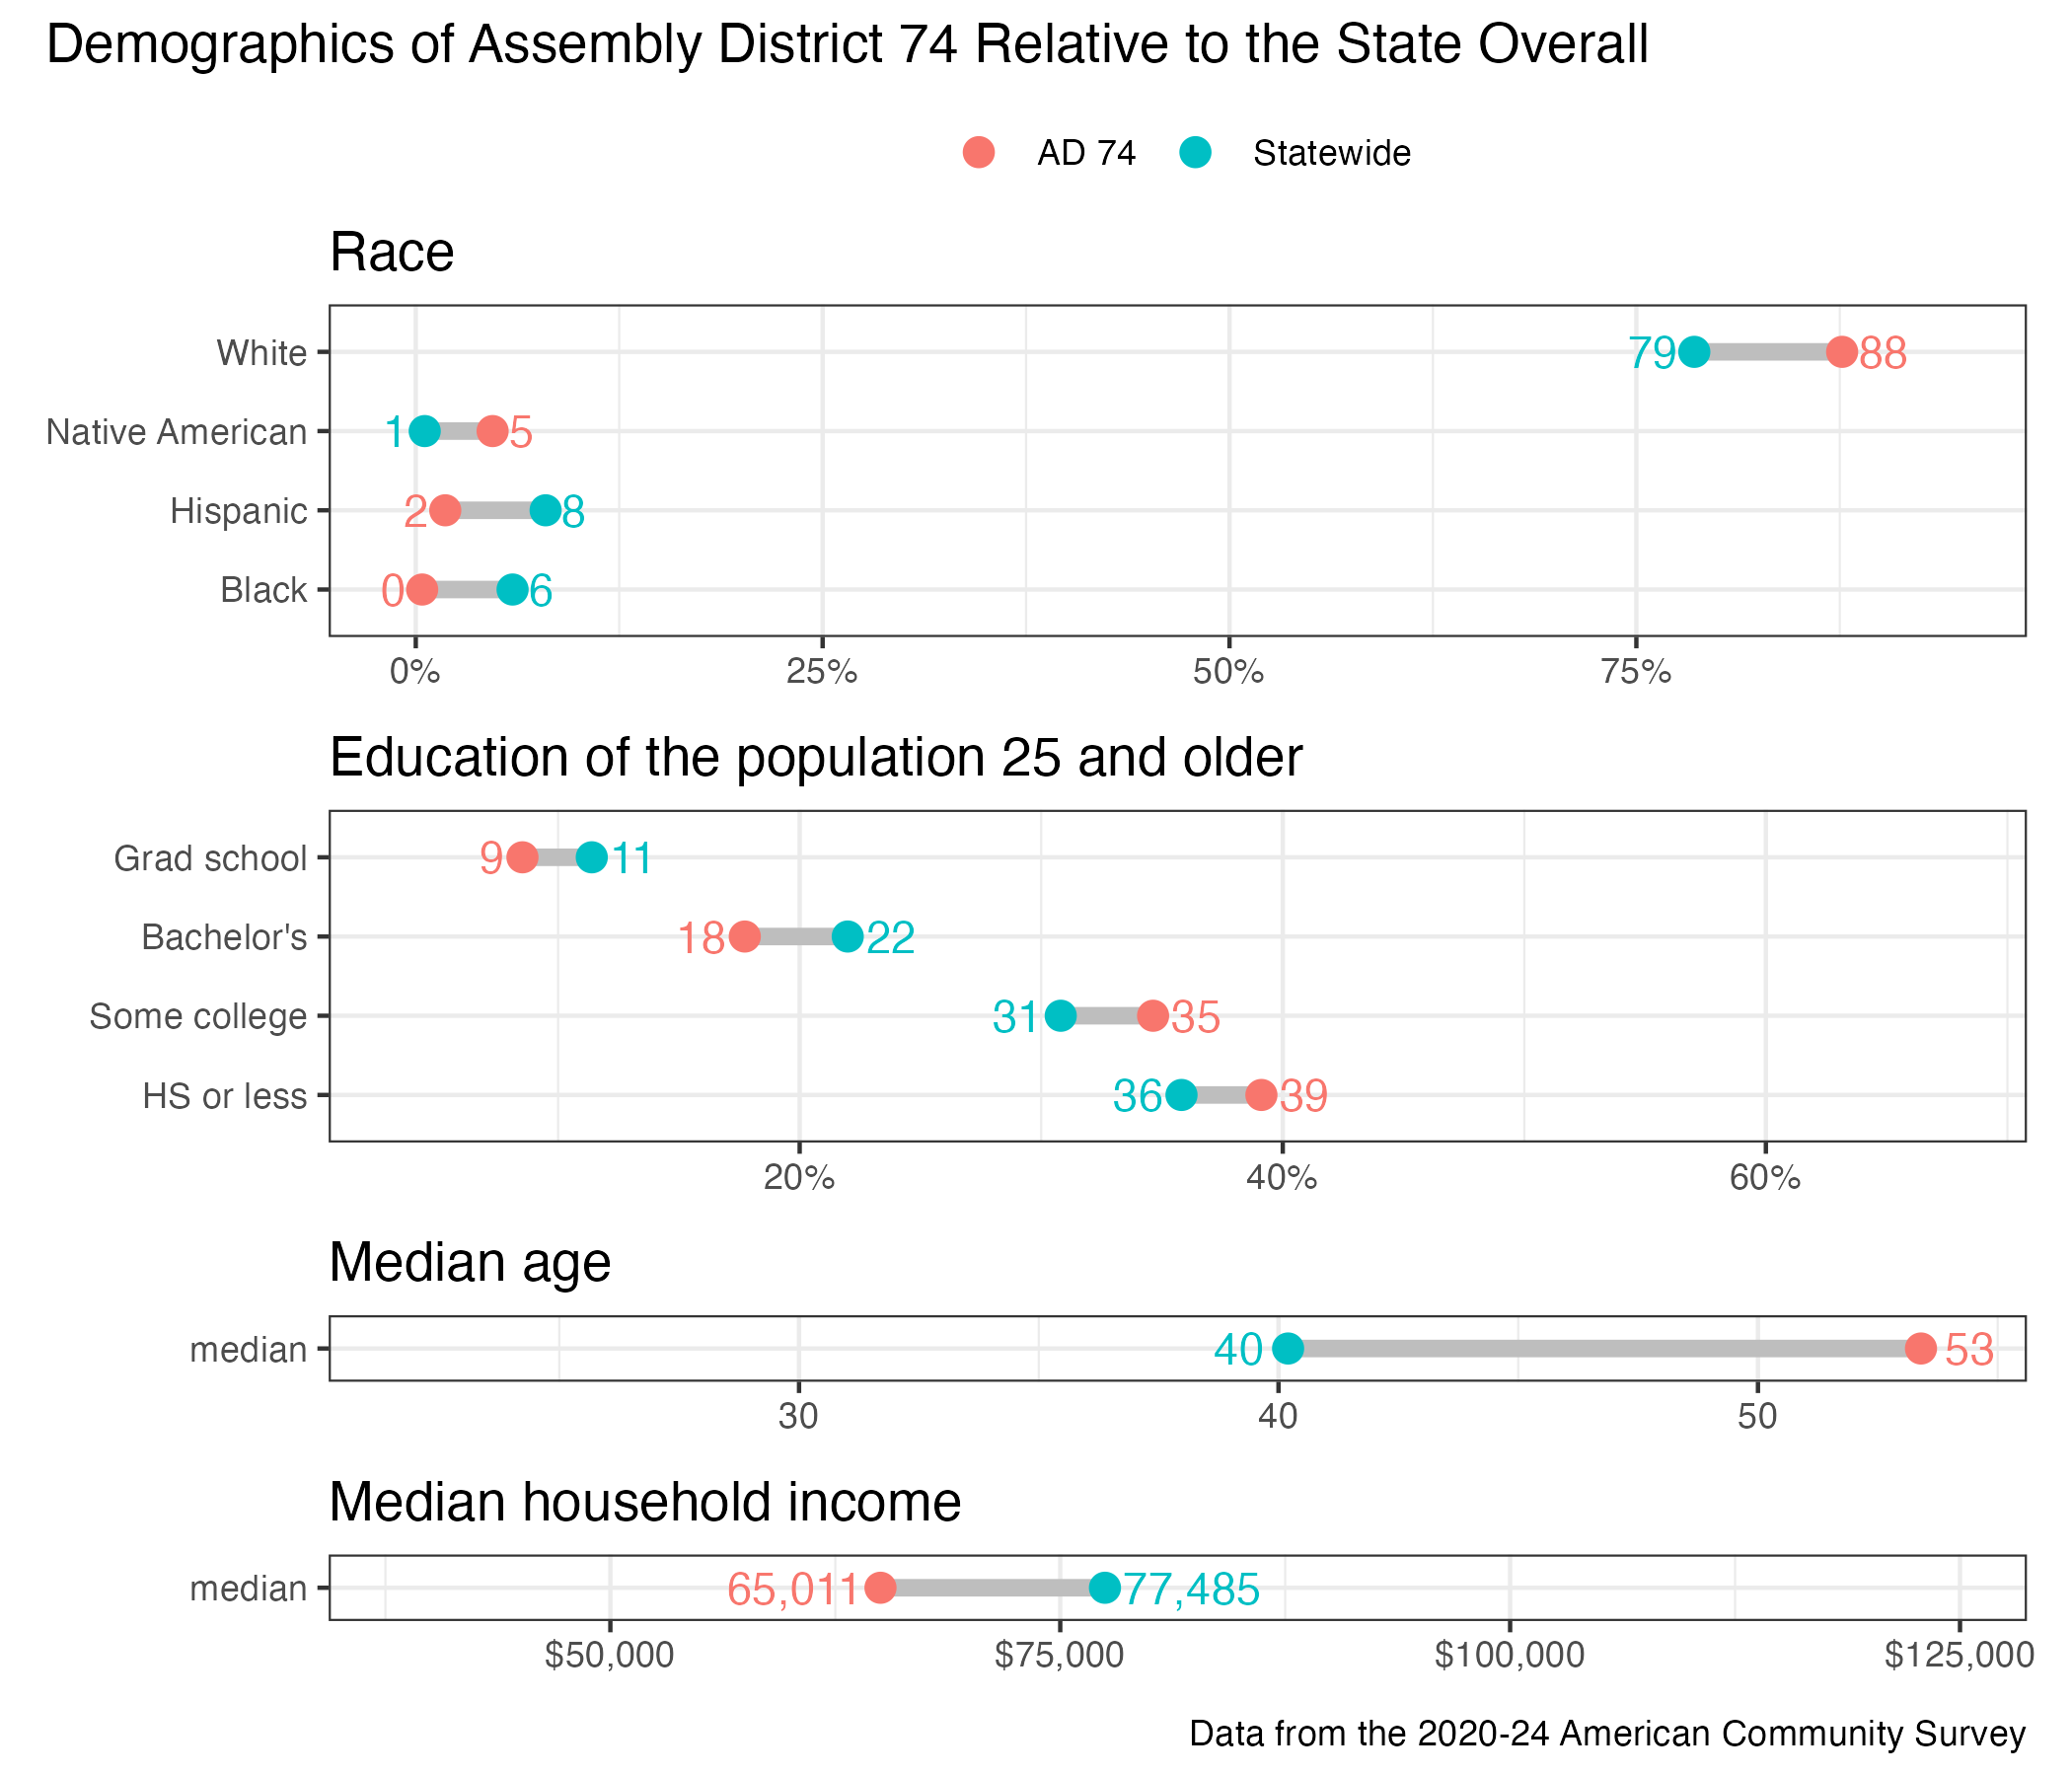
District demographics