59th Assembly District
District
Candidates
| Assembly District 59 Candidates on the Primary Ballot | ||
| Incumbent: Robert Brooks (Filed Notification of Noncandidacy) | ||
Jan 1 thru July 30
|
||
|---|---|---|
| receipts | disbursements | |
| Republican | ||
| Bradley Petersen | $22,700.00 | $7,728.86 |
| Democratic | ||
| Jack Holzman | $5,624.10 | $387.44 |
| Data from the 2026 July Continuing Report. Any amended reports might not yet be shown. | ||
Past election results
| Election Results in Wisconsin State Assembly District 59 | ||||||
votes
|
Dem. %1 |
margin (Dem. - Rep.)
|
||||
|---|---|---|---|---|---|---|
| total | Dem. | Rep. | votes | points2 | ||
| 2016 President | 34,765 | 8,264 | 24,486 | 25.2% | −16,222 | −49.5 |
| 2016 Senator | 34,861 | 8,220 | 25,796 | 24.2% | −17,576 | −51.7 |
| 2018 Governor | 31,035 | 7,473 | 23,137 | 24.4% | −15,664 | −51.2 |
| 2018 Senator | 30,810 | 9,345 | 21,446 | 30.3% | −12,101 | −39.3 |
| 2020 President | 38,978 | 9,829 | 28,567 | 25.6% | −18,738 | −48.8 |
| 2022 Governor | 32,991 | 8,303 | 24,393 | 25.4% | −16,090 | −49.2 |
| 2022 Senator | 32,902 | 7,928 | 24,943 | 24.1% | −17,015 | −51.8 |
| 2024 President | 40,155 | 10,215 | 29,395 | 25.8% | −19,180 | −48.4 |
| 2024 Senator | 39,841 | 10,193 | 28,901 | 26.1% | −18,708 | −47.9 |
| 2024 WI Assembly | 38,719 | 9,369 | 29,315 | 24.2% | −19,946 | −51.6 |
| 2025 WI Sup. Ct.3 | 28,665 | 8,204 | 20,453 | 28.6% | −12,249 | −42.7 |
| 1 Share of the two-party vote. For Rep. share, subtract from 100. | ||||||
| 2 Dem % of the two-party vote minus Rep % of the two-party vote | ||||||
| 3 Formally nonpartisan candidates assigned party labels based on state endorsements | ||||||
| Election results allocated into 2024 district boundaries based on population overlap. Calculations by John Johnson (johndjohnson.info). | ||||||
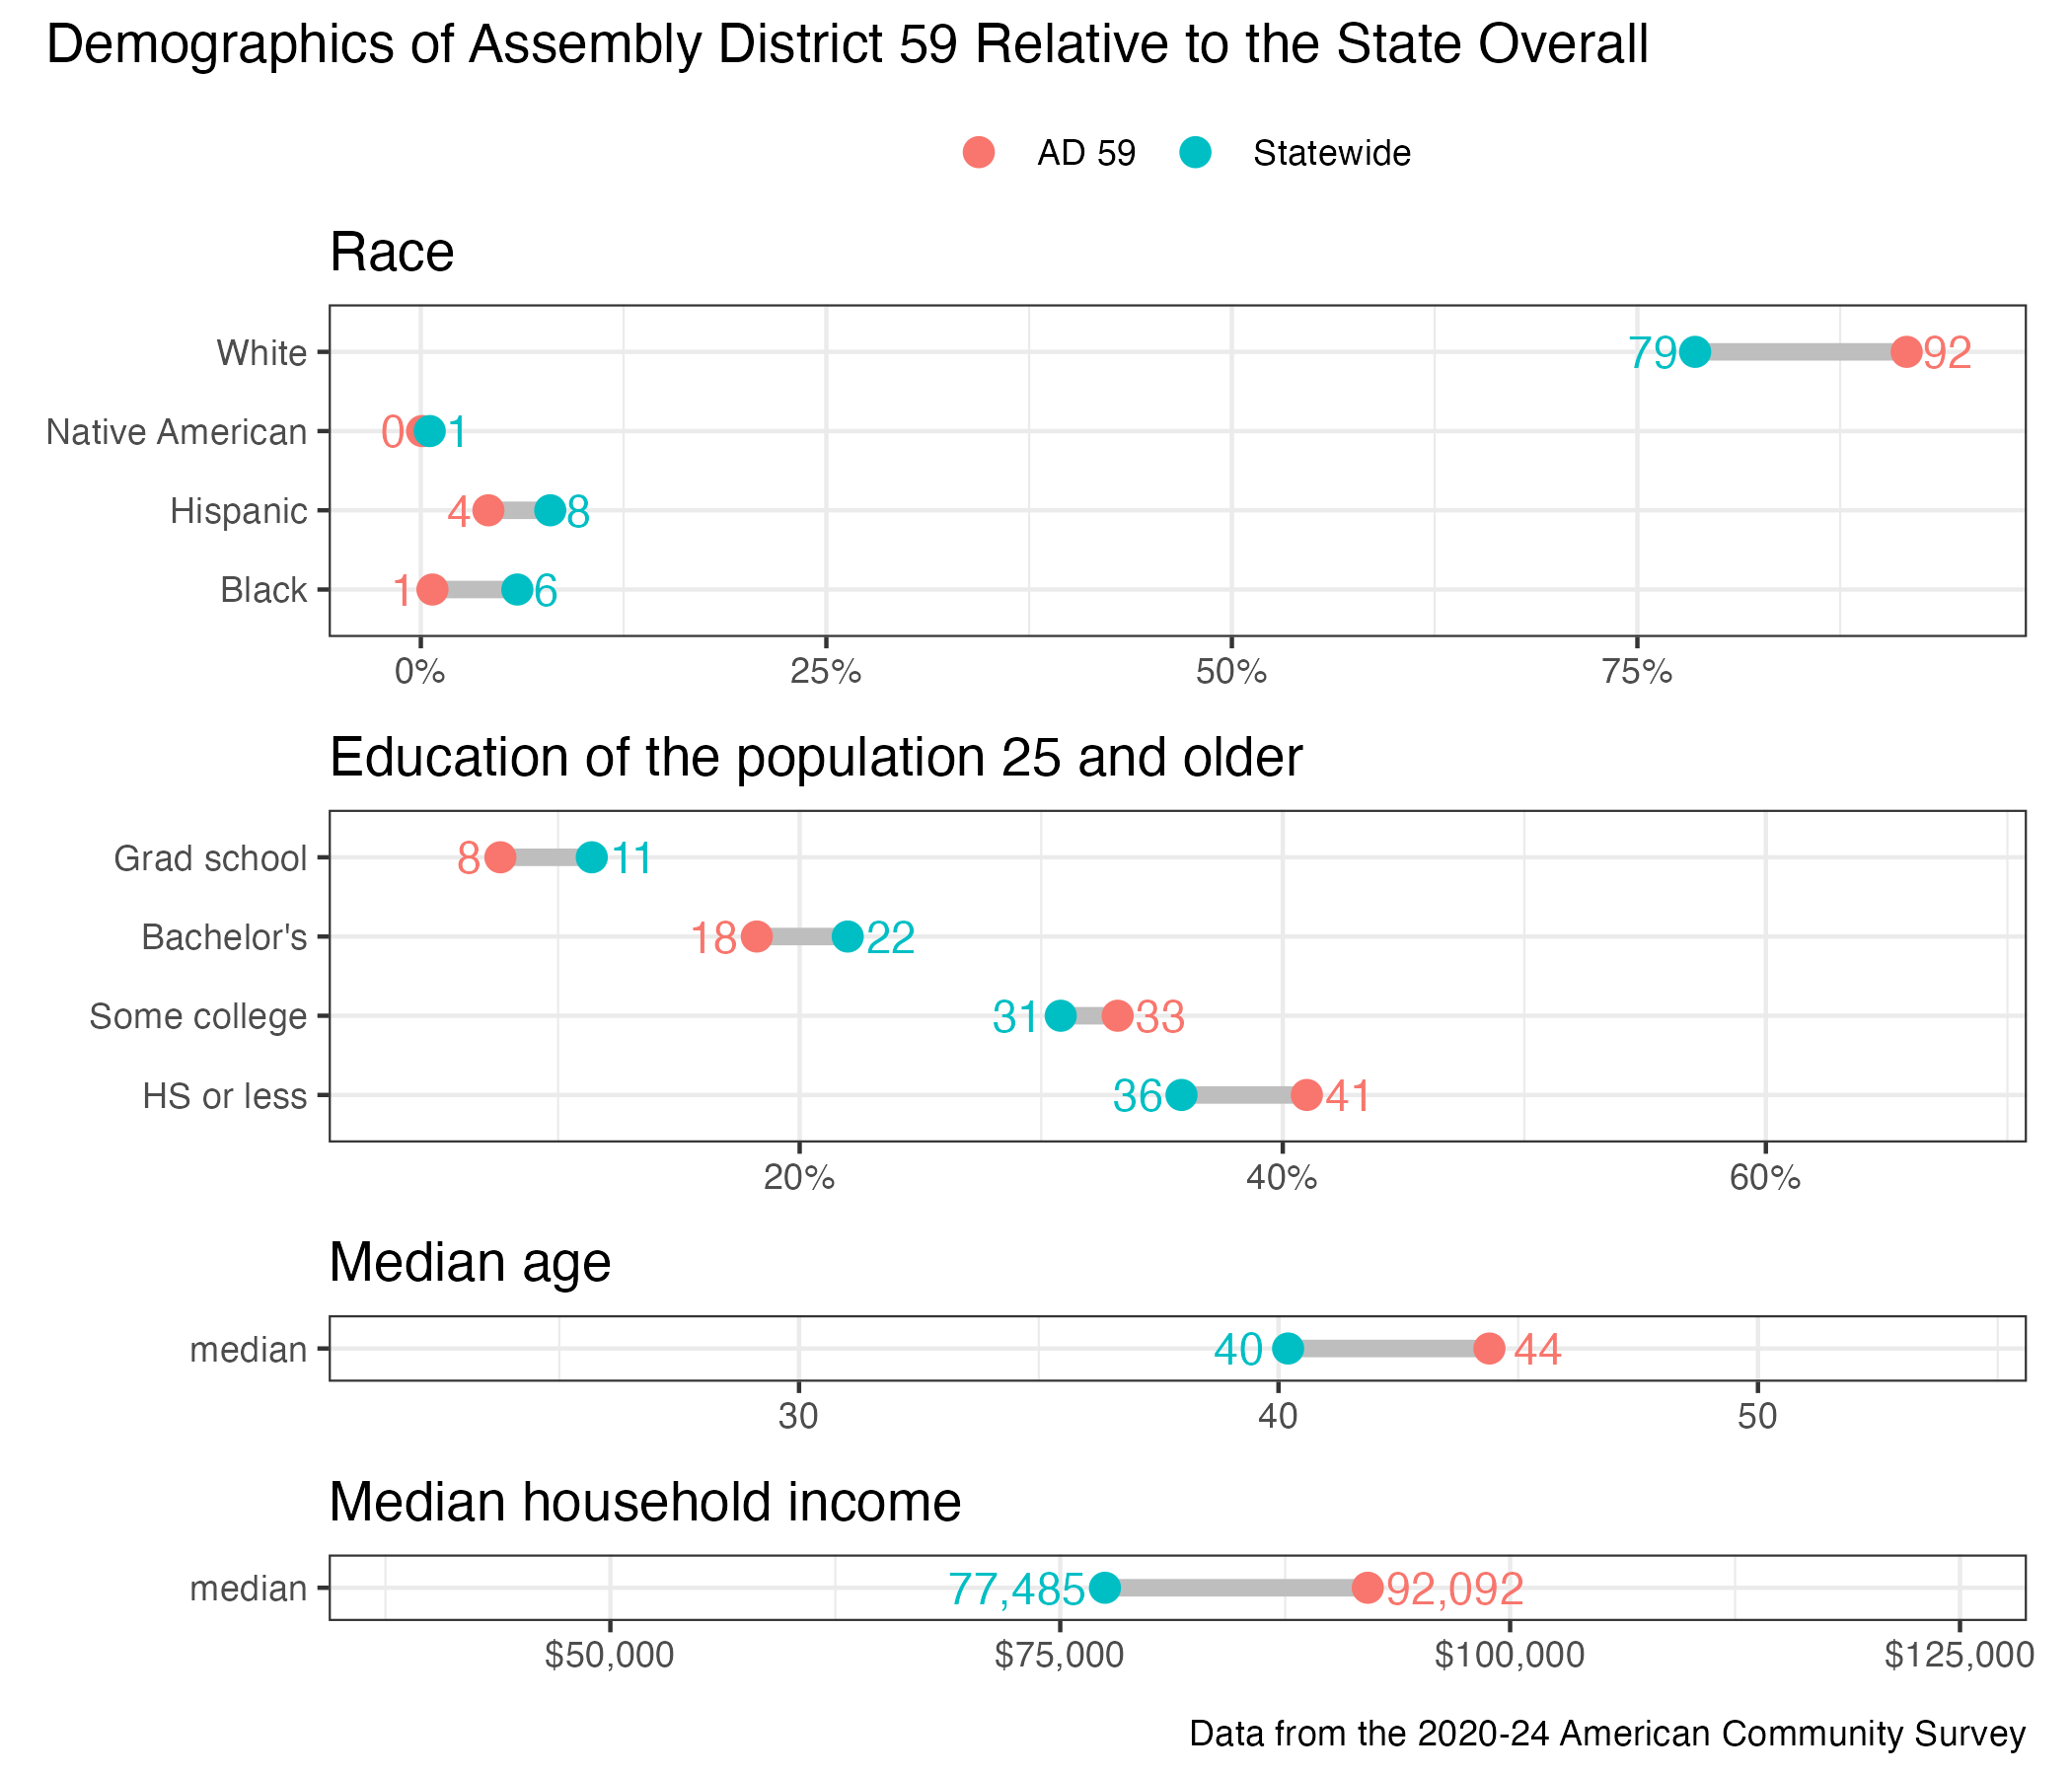
District demographics