97th Assembly District
District
Candidates
| Assembly District 97 Candidates on the Primary Ballot | ||
| Incumbent: Cindi Duchow | ||
Jan 1 thru July 30
|
||
|---|---|---|
| receipts | disbursements | |
| Republican | ||
| Cindi Duchow | $4,459.37 | $18,000.71 |
| Data from the 2026 July Continuing Report. Any amended reports might not yet be shown. | ||
Past election results
| Election Results in Wisconsin State Assembly District 97 | ||||||
votes
|
Dem. %1 |
margin (Dem. - Rep.)
|
||||
|---|---|---|---|---|---|---|
| total | Dem. | Rep. | votes | points2 | ||
| 2016 President | 36,662 | 10,338 | 23,919 | 30.2% | −13,581 | −39.6 |
| 2016 Senator | 36,702 | 9,459 | 26,559 | 26.3% | −17,100 | −47.5 |
| 2018 Governor | 34,489 | 9,647 | 24,428 | 28.3% | −14,781 | −43.4 |
| 2018 Senator | 34,253 | 11,177 | 23,040 | 32.7% | −11,863 | −34.7 |
| 2020 President | 41,827 | 13,537 | 27,617 | 32.9% | −14,080 | −34.2 |
| 2022 Governor | 35,510 | 11,629 | 23,583 | 33.0% | −11,954 | −33.9 |
| 2022 Senator | 35,448 | 10,927 | 24,449 | 30.9% | −13,522 | −38.2 |
| 2024 President | 42,897 | 13,909 | 28,349 | 32.9% | −14,440 | −34.2 |
| 2024 Senator | 42,603 | 13,523 | 28,403 | 32.3% | −14,880 | −35.5 |
| 2024 WI Assembly | 41,505 | 12,011 | 29,443 | 29.0% | −17,432 | −42.1 |
| 2025 WI Sup. Ct.3 | 31,845 | 10,985 | 20,846 | 34.5% | −9,861 | −31.0 |
| 1 Share of the two-party vote. For Rep. share, subtract from 100. | ||||||
| 2 Dem % of the two-party vote minus Rep % of the two-party vote | ||||||
| 3 Formally nonpartisan candidates assigned party labels based on state endorsements | ||||||
| Election results allocated into 2024 district boundaries based on population overlap. Calculations by John Johnson (johndjohnson.info). | ||||||
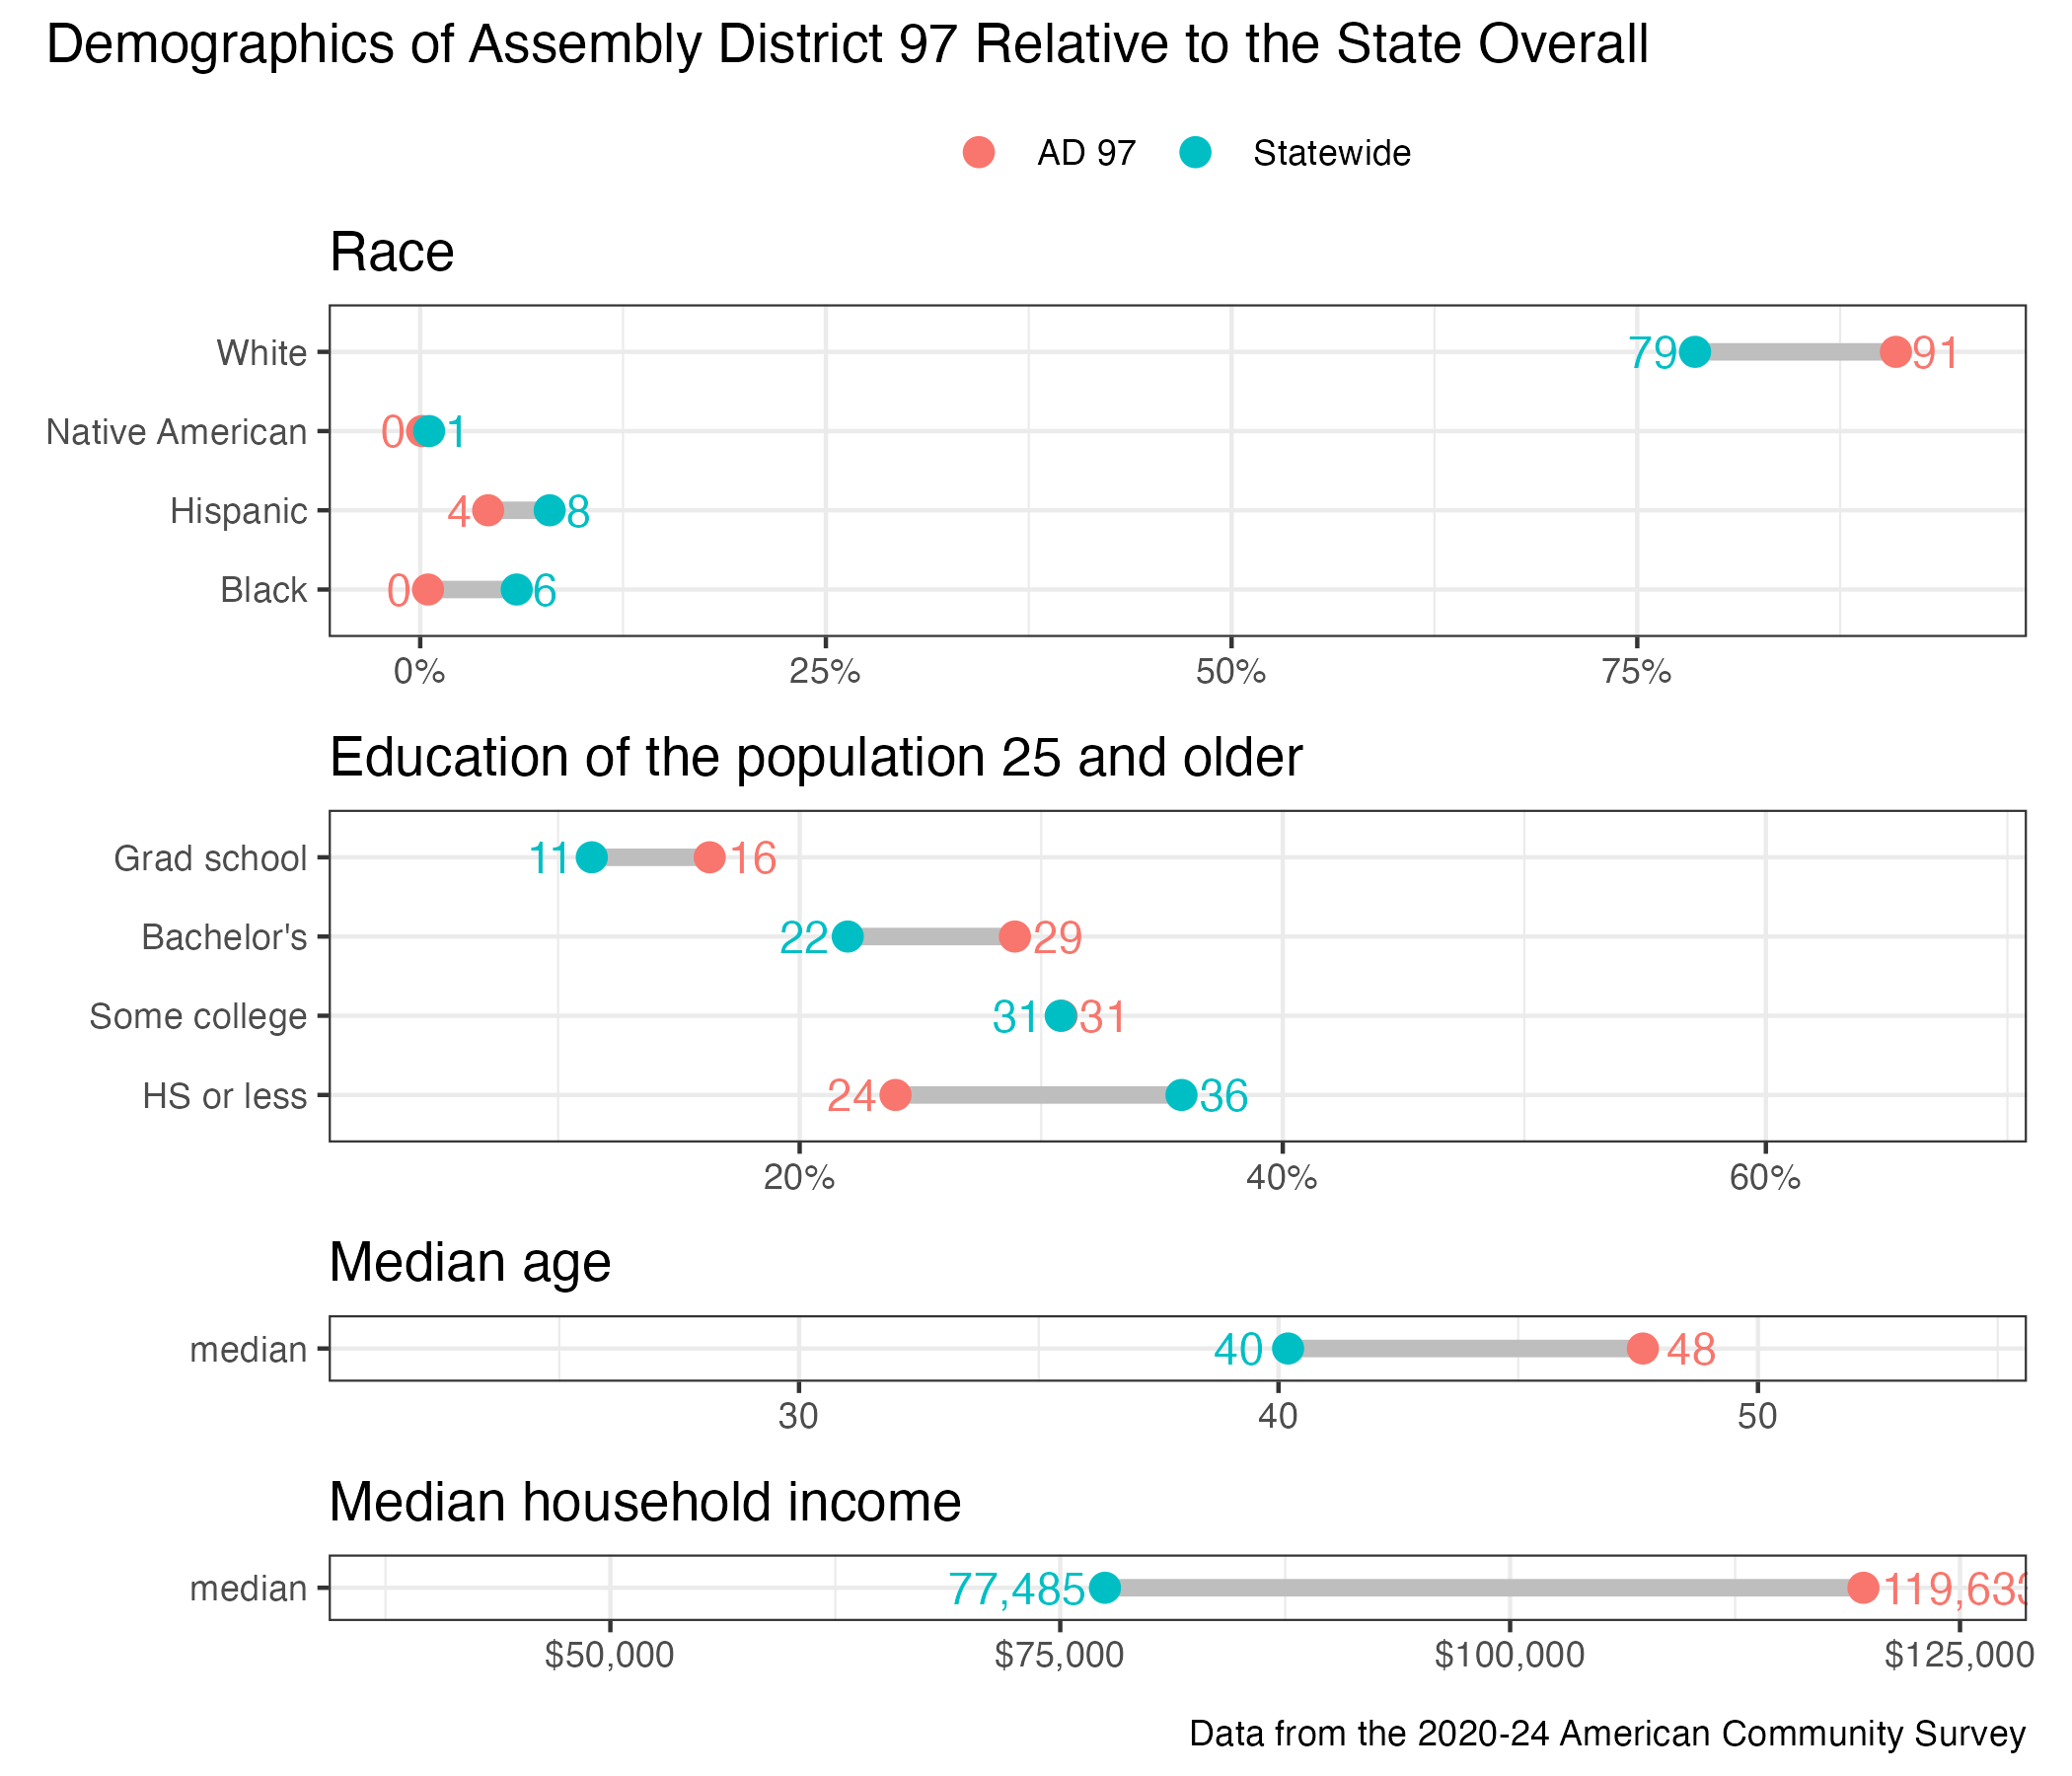
District demographics