67th Assembly District
District
Candidates
| Assembly District 67 Candidates on the Primary Ballot | ||
| Incumbent: David Armstrong | ||
Jan 1 thru July 30
|
||
|---|---|---|
| receipts | disbursements | |
| Republican | ||
| David Armstrong | $8,090.00 | $1,710.06 |
| Democratic | ||
| Indiana Thompson | $4,764.00 | $1,288.67 |
| Data from the 2026 July Continuing Report. Any amended reports might not yet be shown. | ||
Past election results
| Election Results in Wisconsin State Assembly District 67 | ||||||
votes
|
Dem. %1 |
margin (Dem. - Rep.)
|
||||
|---|---|---|---|---|---|---|
| total | Dem. | Rep. | votes | points2 | ||
| 2016 President | 29,324 | 10,197 | 17,550 | 36.7% | −7,353 | −26.5 |
| 2016 Senator | 28,946 | 11,275 | 16,644 | 40.4% | −5,369 | −19.2 |
| 2018 Governor | 24,341 | 9,995 | 13,925 | 41.8% | −3,930 | −16.4 |
| 2018 Senator | 24,246 | 11,279 | 12,956 | 46.5% | −1,677 | −6.9 |
| 2020 President | 32,949 | 11,915 | 20,549 | 36.7% | −8,634 | −26.6 |
| 2022 Governor | 26,108 | 9,812 | 15,881 | 38.2% | −6,069 | −23.6 |
| 2022 Senator | 26,052 | 9,217 | 16,805 | 35.4% | −7,588 | −29.2 |
| 2024 President | 34,839 | 11,672 | 21,936 | 34.7% | −10,264 | −30.5 |
| 2024 Senator | 34,489 | 12,151 | 21,404 | 36.2% | −9,253 | −27.6 |
| 2024 WI Assembly | 34,083 | 11,021 | 23,049 | 32.3% | −12,028 | −35.3 |
| 2025 WI Sup. Ct.3 | 23,269 | 9,234 | 14,029 | 39.7% | −4,795 | −20.6 |
| 1 Share of the two-party vote. For Rep. share, subtract from 100. | ||||||
| 2 Dem % of the two-party vote minus Rep % of the two-party vote | ||||||
| 3 Formally nonpartisan candidates assigned party labels based on state endorsements | ||||||
| Election results allocated into 2024 district boundaries based on population overlap. Calculations by John Johnson (johndjohnson.info). | ||||||
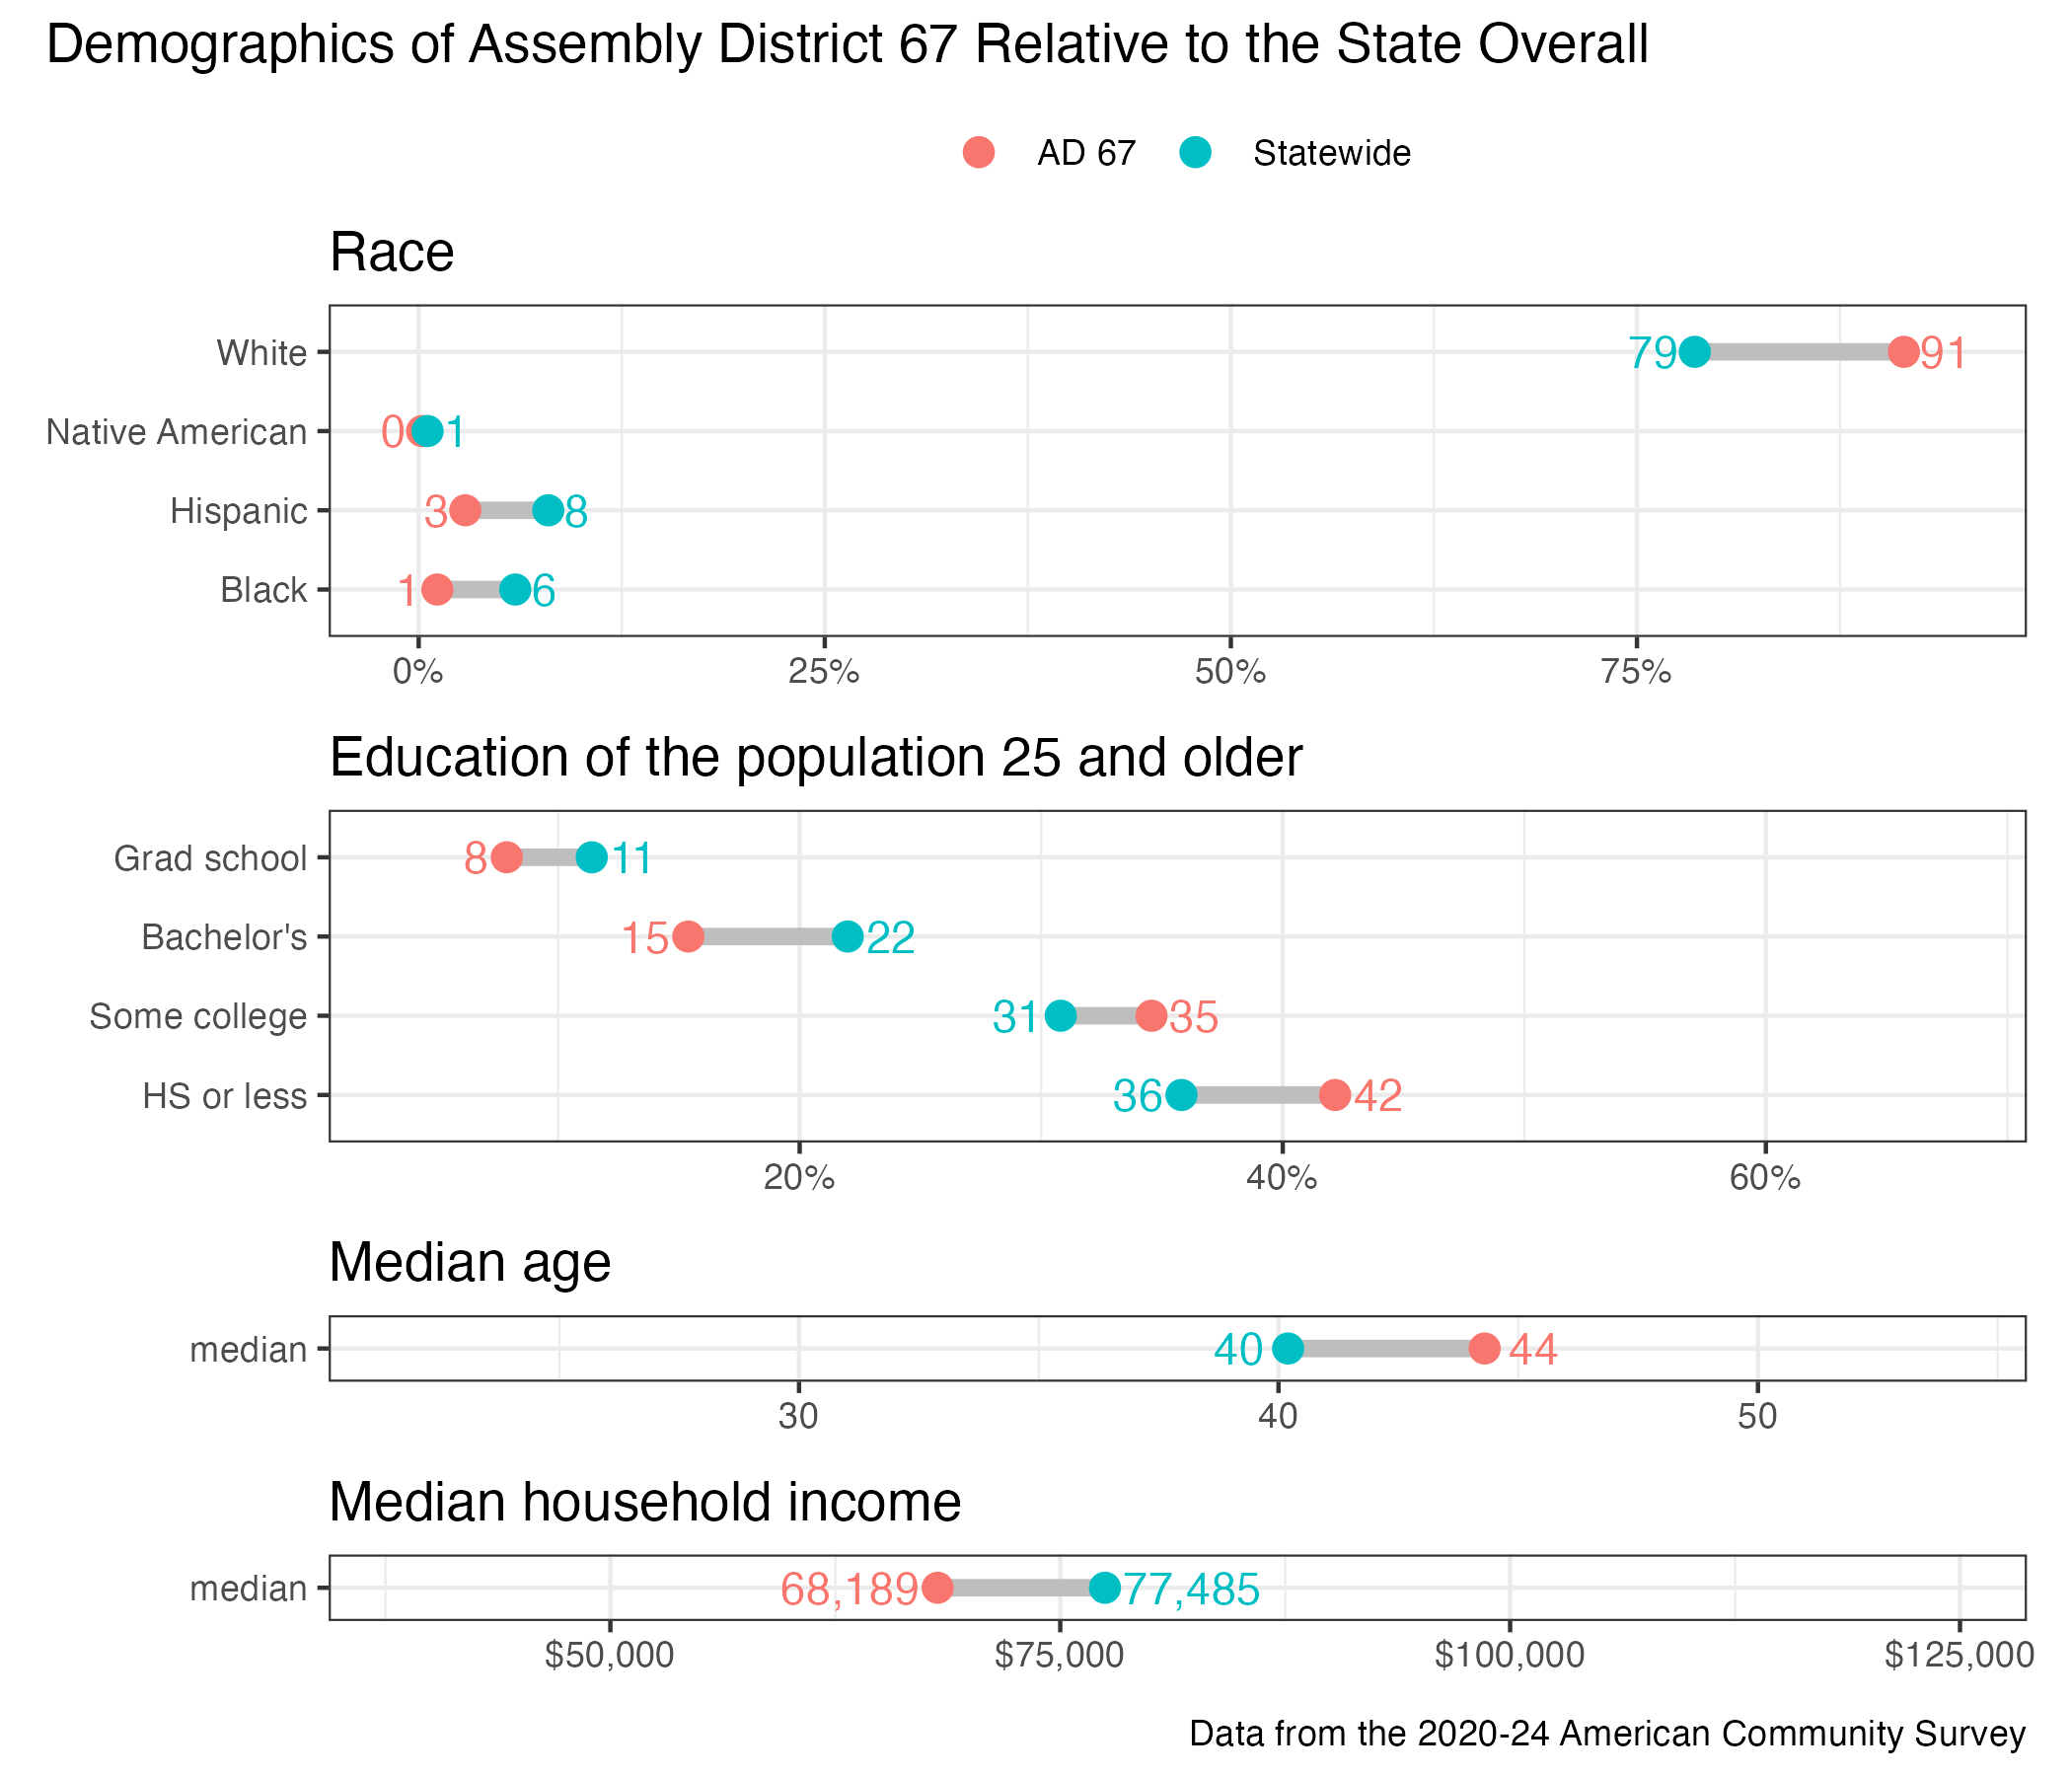
District demographics