99th Assembly District
District
Candidates
| Assembly District 99 Candidates on the Primary Ballot | ||
| Incumbent: Barbara Dittrich | ||
Jan 1 thru July 30
|
||
|---|---|---|
| receipts | disbursements | |
| Republican | ||
| Barbara Dittrich | $15,030.00 | $13,263.75 |
| Data from the 2026 July Continuing Report. Any amended reports might not yet be shown. | ||
Past election results
| Election Results in Wisconsin State Assembly District 99 | ||||||
votes
|
Dem. %1 |
margin (Dem. - Rep.)
|
||||
|---|---|---|---|---|---|---|
| total | Dem. | Rep. | votes | points2 | ||
| 2016 President | 34,473 | 9,598 | 22,754 | 29.7% | −13,156 | −40.7 |
| 2016 Senator | 34,541 | 8,742 | 25,119 | 25.8% | −16,377 | −48.4 |
| 2018 Governor | 32,079 | 8,738 | 22,934 | 27.6% | −14,196 | −44.8 |
| 2018 Senator | 31,938 | 10,509 | 21,390 | 32.9% | −10,881 | −34.1 |
| 2020 President | 39,762 | 13,098 | 26,041 | 33.5% | −12,943 | −33.1 |
| 2022 Governor | 33,663 | 11,216 | 22,171 | 33.6% | −10,955 | −32.8 |
| 2022 Senator | 33,597 | 10,562 | 22,966 | 31.5% | −12,404 | −37.0 |
| 2024 President | 41,608 | 13,863 | 27,129 | 33.8% | −13,266 | −32.4 |
| 2024 Senator | 41,328 | 13,544 | 27,178 | 33.3% | −13,634 | −33.5 |
| 2024 WI Assembly | 32,962 | 0 | 32,132 | 0.0% | −32,132 | −100.0 |
| 2025 WI Sup. Ct.3 | 30,340 | 10,844 | 19,481 | 35.8% | −8,637 | −28.5 |
| 1 Share of the two-party vote. For Rep. share, subtract from 100. | ||||||
| 2 Dem % of the two-party vote minus Rep % of the two-party vote | ||||||
| 3 Formally nonpartisan candidates assigned party labels based on state endorsements | ||||||
| Election results allocated into 2024 district boundaries based on population overlap. Calculations by John Johnson (johndjohnson.info). | ||||||
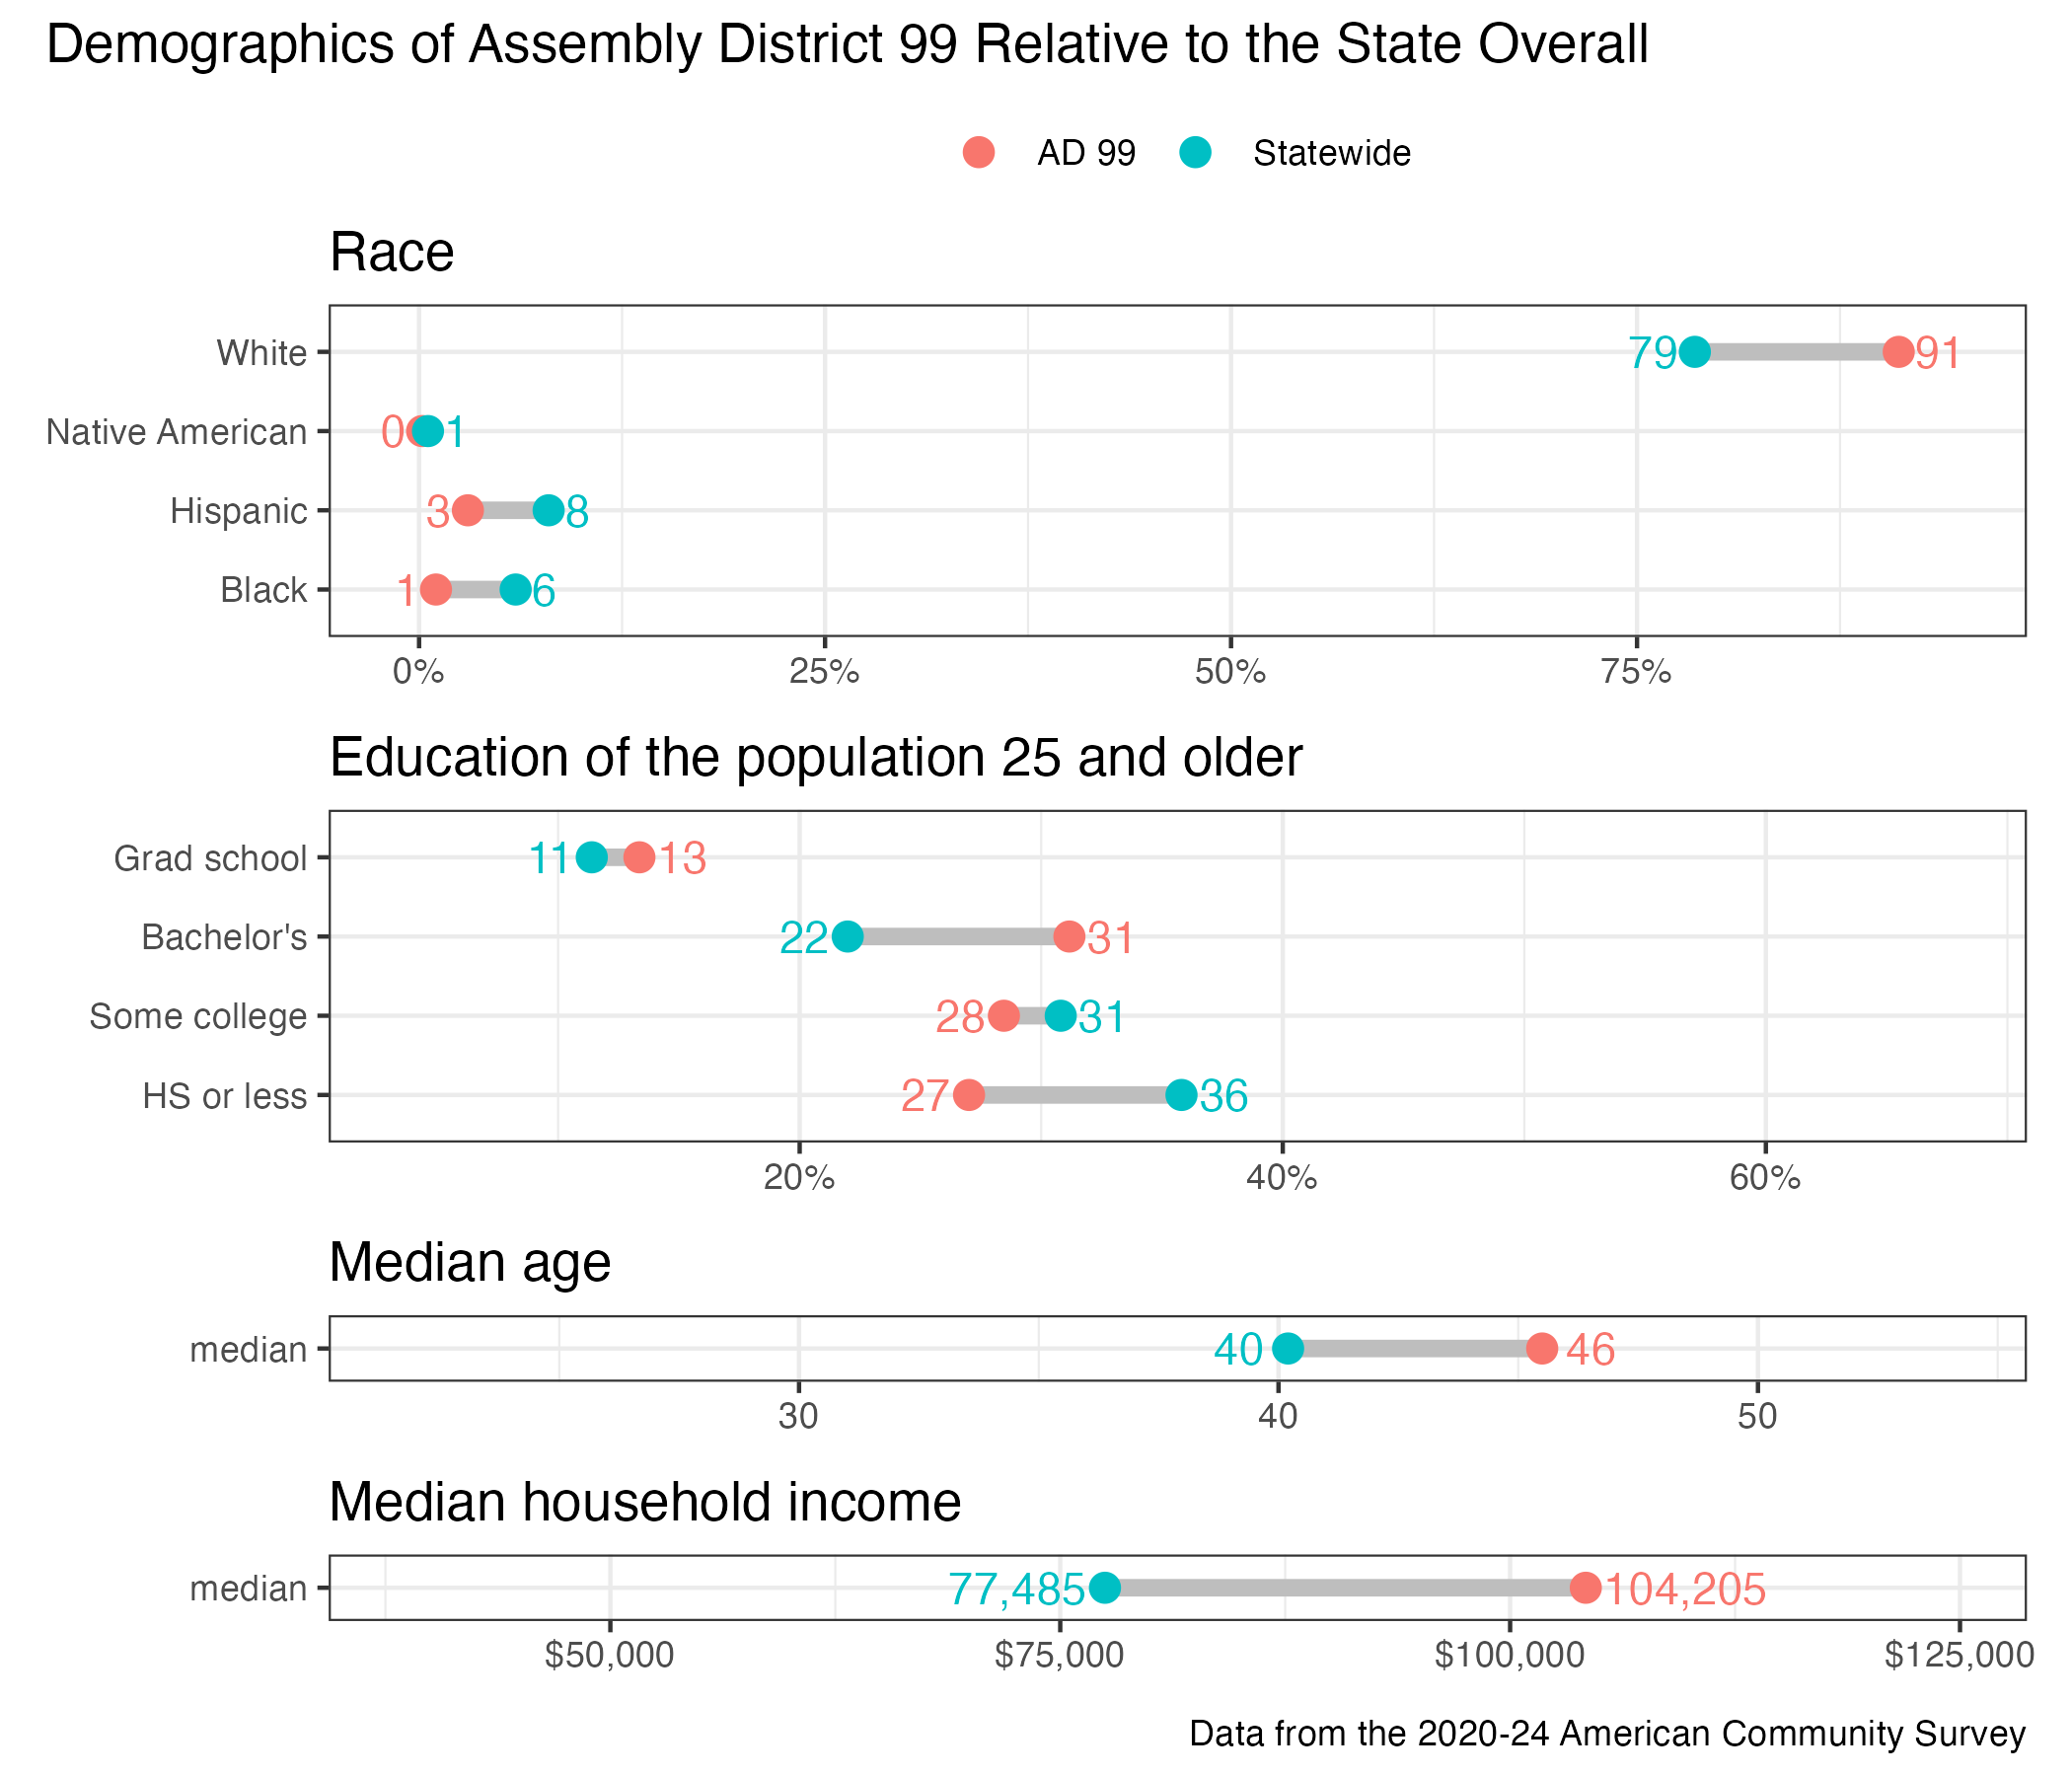
District demographics