89th Assembly District
District
Candidates
| Assembly District 89 Candidates on the Primary Ballot | ||
| Incumbent: Ryan Spaude | ||
Jan 1 thru July 30
|
||
|---|---|---|
| receipts | disbursements | |
| Republican | ||
| Bobby R. Lindsey | $9,310.00 | $952.52 |
| Democratic | ||
| Ryan Spaude | $70,570.97 | $11,114.23 |
| Data from the 2026 July Continuing Report. Any amended reports might not yet be shown. | ||
Past election results
| Election Results in Wisconsin State Assembly District 89 | ||||||
votes
|
Dem. %1 |
margin (Dem. - Rep.)
|
||||
|---|---|---|---|---|---|---|
| total | Dem. | Rep. | votes | points2 | ||
| 2016 President | 28,436 | 12,673 | 13,791 | 47.9% | −1,118 | −4.2 |
| 2016 Senator | 27,994 | 12,162 | 14,530 | 45.6% | −2,368 | −8.9 |
| 2018 Governor | 25,030 | 12,248 | 12,099 | 50.3% | +149 | +0.6 |
| 2018 Senator | 24,907 | 13,968 | 10,877 | 56.2% | +3,091 | +12.4 |
| 2020 President | 30,552 | 15,109 | 14,856 | 50.4% | +253 | +0.8 |
| 2022 Governor | 23,086 | 12,075 | 10,669 | 53.1% | +1,406 | +6.2 |
| 2022 Senator | 23,012 | 11,578 | 11,376 | 50.4% | +202 | +0.9 |
| 2024 President | 30,533 | 15,328 | 14,713 | 51.0% | +615 | +2.0 |
| 2024 Senator | 30,257 | 15,319 | 14,084 | 52.1% | +1,235 | +4.2 |
| 2024 WI Assembly | 29,559 | 15,169 | 14,343 | 51.4% | +826 | +2.8 |
| 2025 WI Sup. Ct.3 | 19,877 | 11,242 | 8,624 | 56.6% | +2,618 | +13.2 |
| 1 Share of the two-party vote. For Rep. share, subtract from 100. | ||||||
| 2 Dem % of the two-party vote minus Rep % of the two-party vote | ||||||
| 3 Formally nonpartisan candidates assigned party labels based on state endorsements | ||||||
| Election results allocated into 2024 district boundaries based on population overlap. Calculations by John Johnson (johndjohnson.info). | ||||||
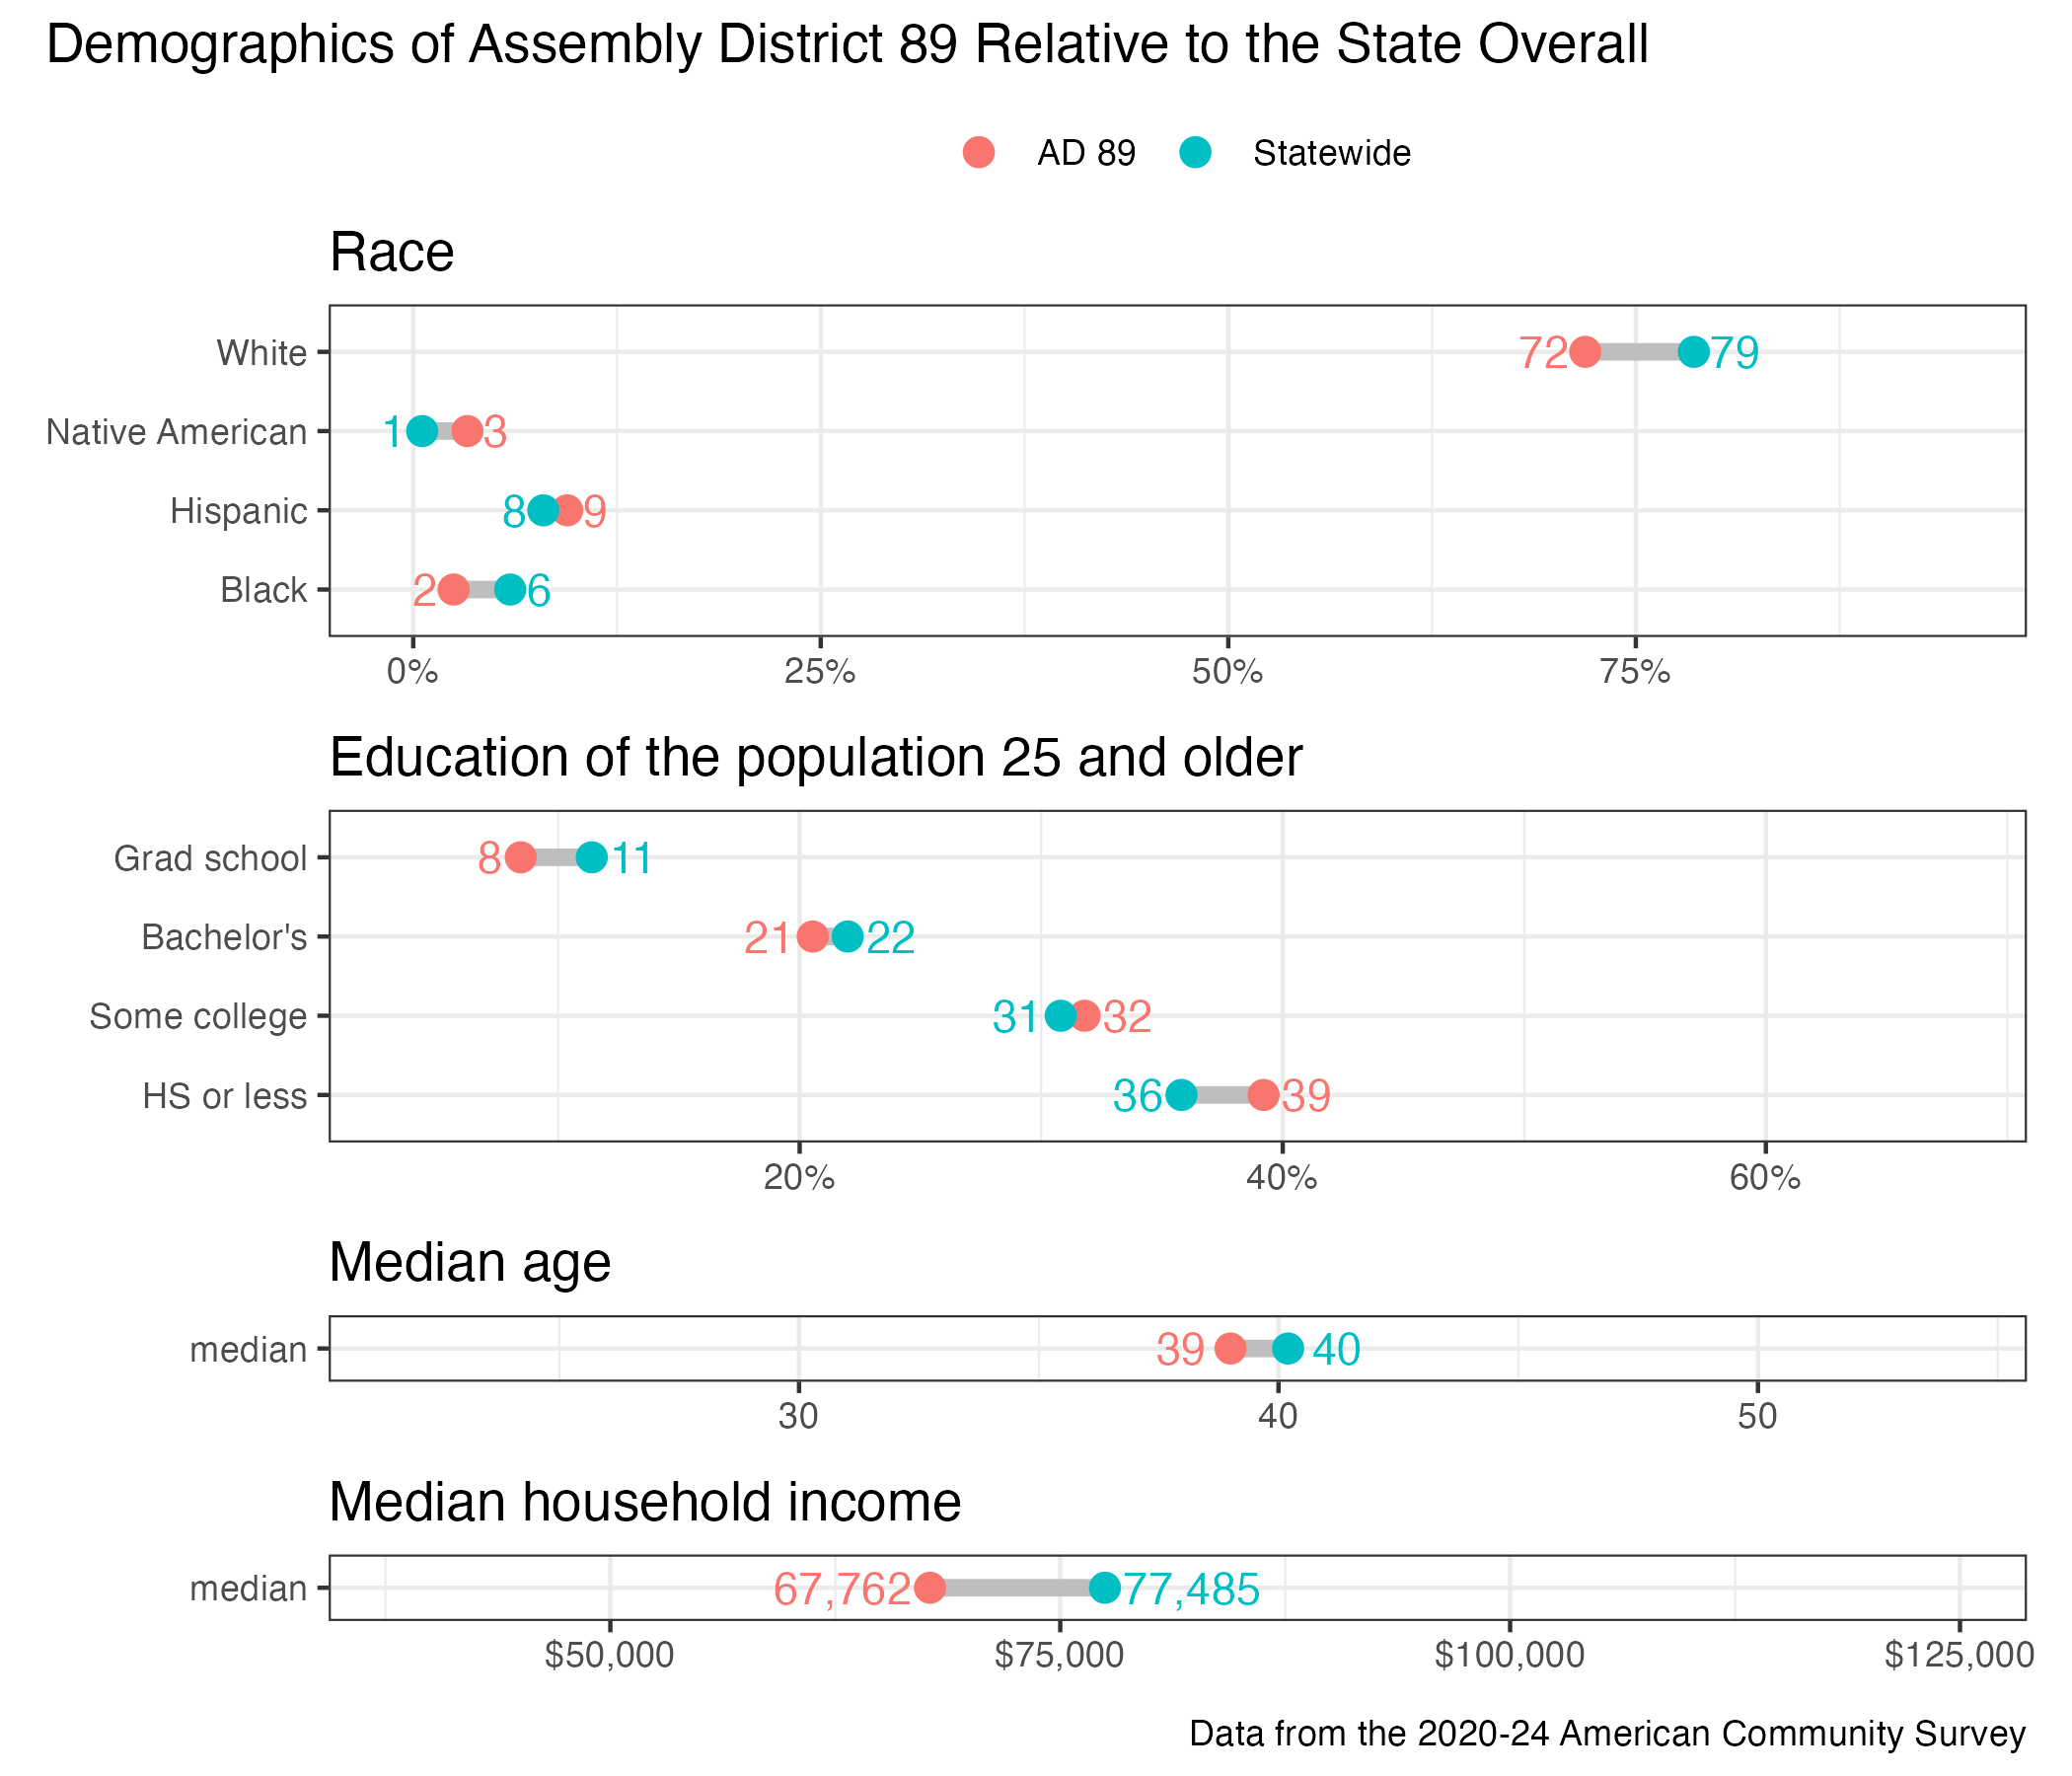
District demographics